Session 7 // The App
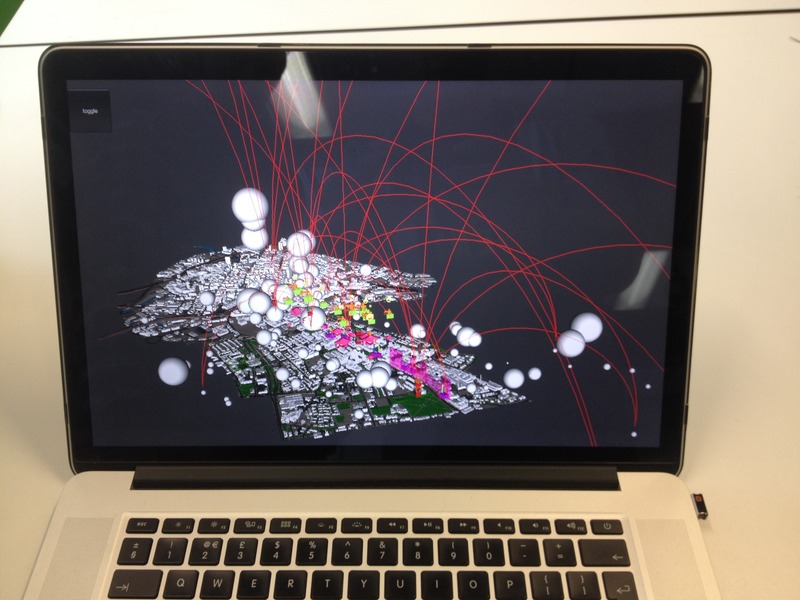
This is how the final Data City App looks after coding from the fifth years and collaborator Eric. It ties together all of the data the five subgroups collected and transforms it from the raw data exhibited in the spreadsheets to produce a visual output overlaid on top of the Manchester City Centre Model from ARUP.
Posted 16 May 2014 13:47
Session 6 // The 'If Else' Statement
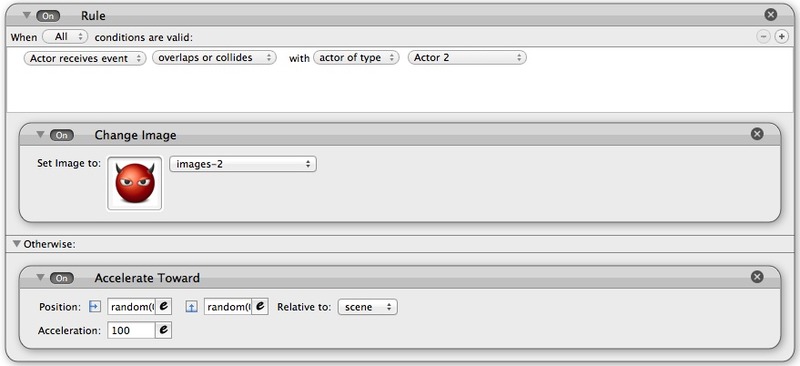
The result that the 'If Else' statement has is the one depicted above. As soon as Actor 1 collides or overlaps with Actor 2, its image changes to an icon of the devil. It then continues to move randomly around the screen.
The process of creating a basic game therefore gave a better understanding behind 'System Dynamics' and how this could be potentially translated to the Data City app.
Posted 16 May 2014 10:28
Session 6 // The 'If Else' Statement
After understanding the logic of the 'If Else' statement in session five, the sixth taught session saw the group exploit the statement in GameSalad.
GameSalad is a basic program that allows you to create a game or animation based upon a series of rules. By creating two actors we can see the effects that the rules have. The statement therefore reads:
If Actor 1 overlaps or collides with Actor 2, then change the image to an icon of a devil.
Otherwise, move randomly around the screen at an acceleration rate of 100.
Posted 16 May 2014 10:25
Session 5 // System Dynamics and a Social Experiment
Ulysses began the fifth taught session by introducing the group to 'System Dynamics'. The idea behind this session was for the group to understand basic idea of how games work and in particular the 'If Else' statement.
Each of us was to therefore come up with an 'If Else' statement which would be passed onto the person sat to our right. I gave Toby:
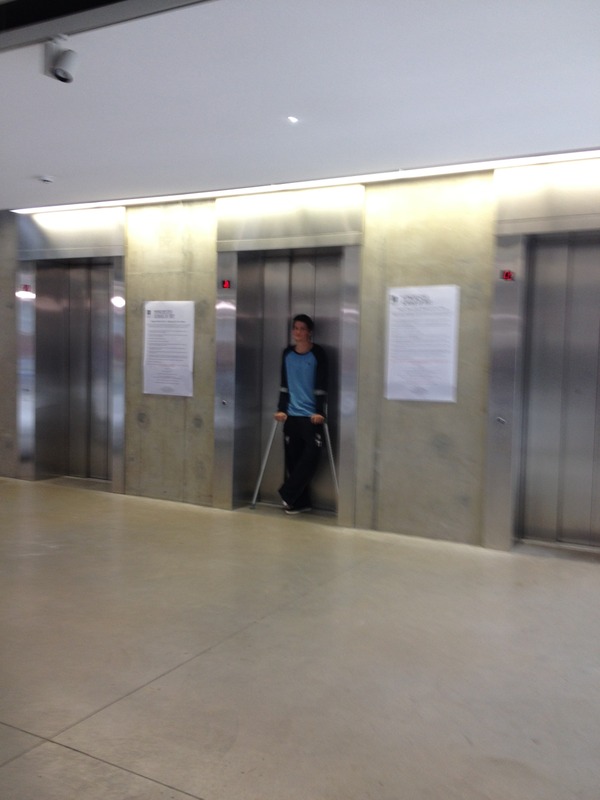
If there's no one stood waiting for a lift in Chatham, go up and press the button and wait in the lobby.
Else, stand on the doorway to the lift and stay there, not letting anybody past.
As a result, there were a few confused people waiting to use the lift as Toby just stood there. This social experiment therefore gave us a basic understanding of 'System Dynamics' and the 'If Else' statement.
Posted 15 May 2014 21:03
Session 5 // An Early Visualisation
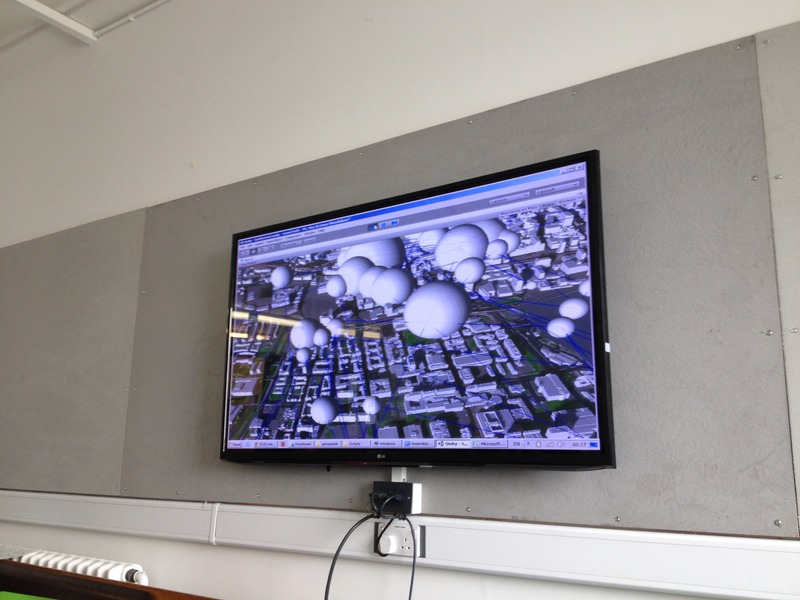
The group gathered for the fifth session with Eric showing an early visualisation of how the property price data has been coded into ARUPs Manchester City Centre Model. By exploiting the longitudinal and latitudinal information linked to each individual piece of collected data, spheres have been created to denote the data with blue lines showing its connection to the rest of the collected data.
This therefore allowed us to see how our collected data can be extracted from the numbers in spreadsheets to create the visualisations for the Data City app.
Posted 15 May 2014 20:52
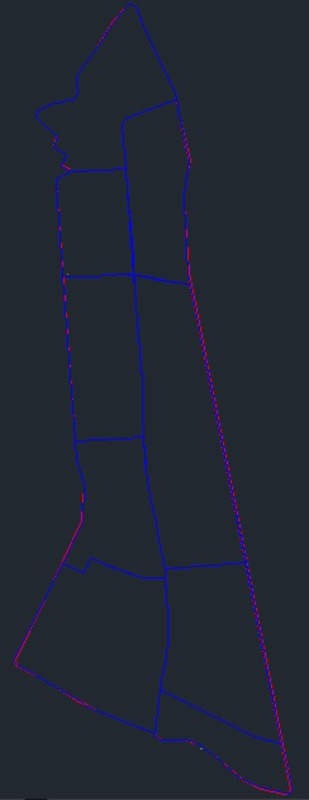
Session 4 // Extracting the Data
In order for the app to be created, Eric asked for each electoral ward to be separated and created into its own GOOGLE SketchUp file. The purpose of this was to create a mesh for the data to be layered onto during the coding process.
Posted 15 May 2014 20:46
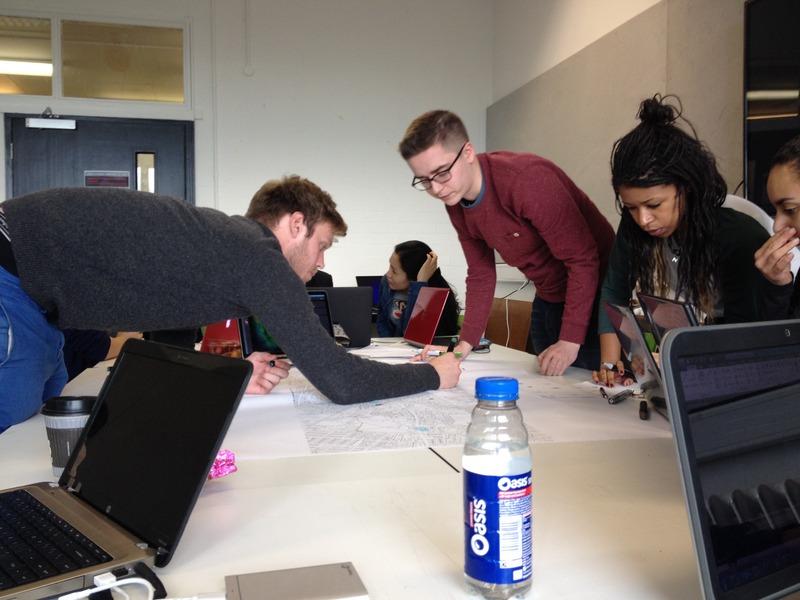
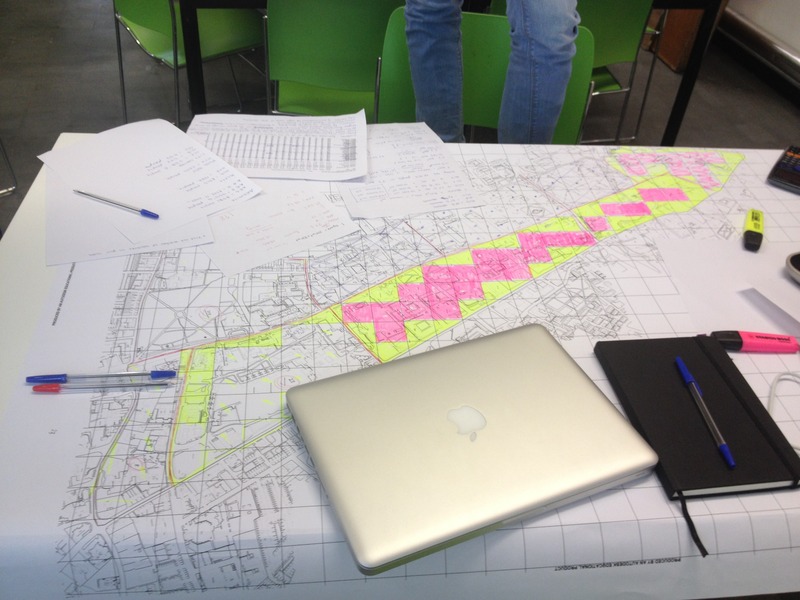
Session 4 // Overlapping the Data
After meeting Eric Cheung, another collaborator of the Data City project, the entire group began the process of layering all of our collected data onto a 2D map of the Oxford Road Corridor.
By doing this, the group were able to see any overlaps in data and how they could be potentially linked with one another. The 2D version also allowed for Eric to talk to the five individual groups in order to understand the research we'd gathered and the methodology for its collection.
Posted 15 May 2014 20:36
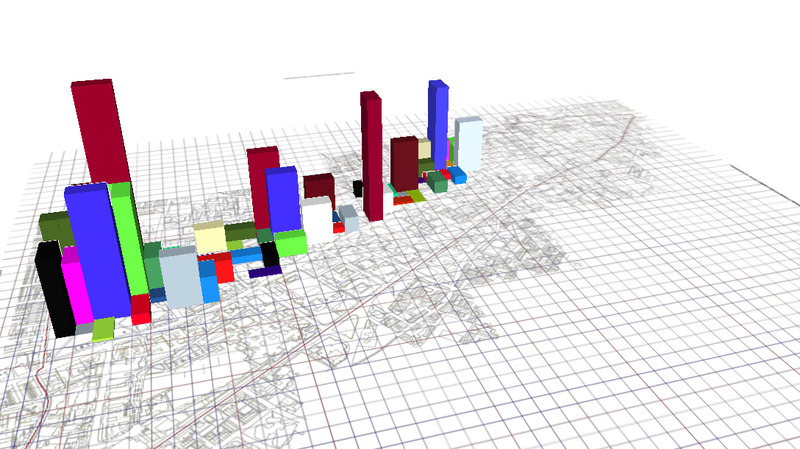
Session 3 // Mapping the Corridor
After analysing both the 1991 and 2011 Manchester Census', the group collected the required information for the ward populations and the breakdown of the age groups.
From this, we had to work out the hectare area of each individual district with a singular ward and then work out the population as a calculated estimation. Once we had the scaled population, we were able to estimate the size of each age group according to the district.
We then began to map 3 of the districts as a GOOGLE SketchUp model, resulting in each age group in a single column. They've then been extruded upwards according to their individual population and colour coded to give the resulting early visualisation of the age distribution along the corridor.
Posted 12 May 2014 11:17
Session 2 // Collecting Methodically
The event split into smaller groups with the intention to focus their 'Big Data' research on a specific area of interest. Our smaller group therefore decided to focus on the 'distribution of age' along the corridor and so to see the density of each age group.
After receiving a CAD drawing of the areas to investigate, we began by investigating 2011 census information and divided the 'corridor boundary' into electoral wards used in the census. From this, we were able to calculate the ward population and the amount of people in each age group for the ward.
Posted 12 May 2014 10:43
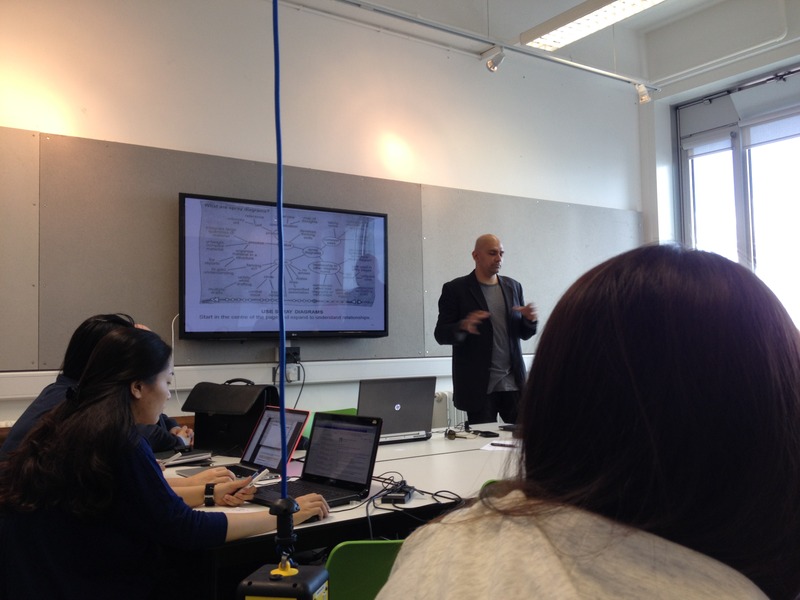
Session 1 // Big Data
Beginning with a talk from Ulysses Sengupta, the group were introduced to 'Big Data', methodologies of collection and the application it can have for the future of architecture. The main idea was that a piece of architecture can only affect a change within a community, so long as the community's 'Big Data' is taken into consideration prior to design.
Posted 12 May 2014 10:18