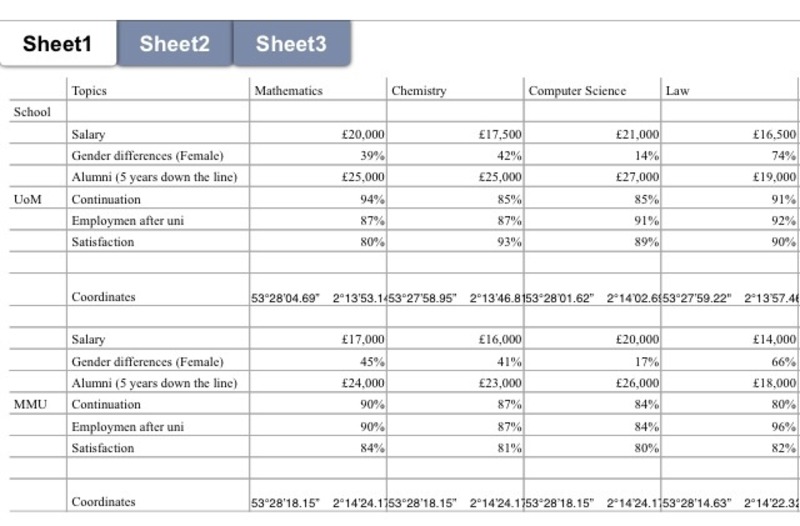
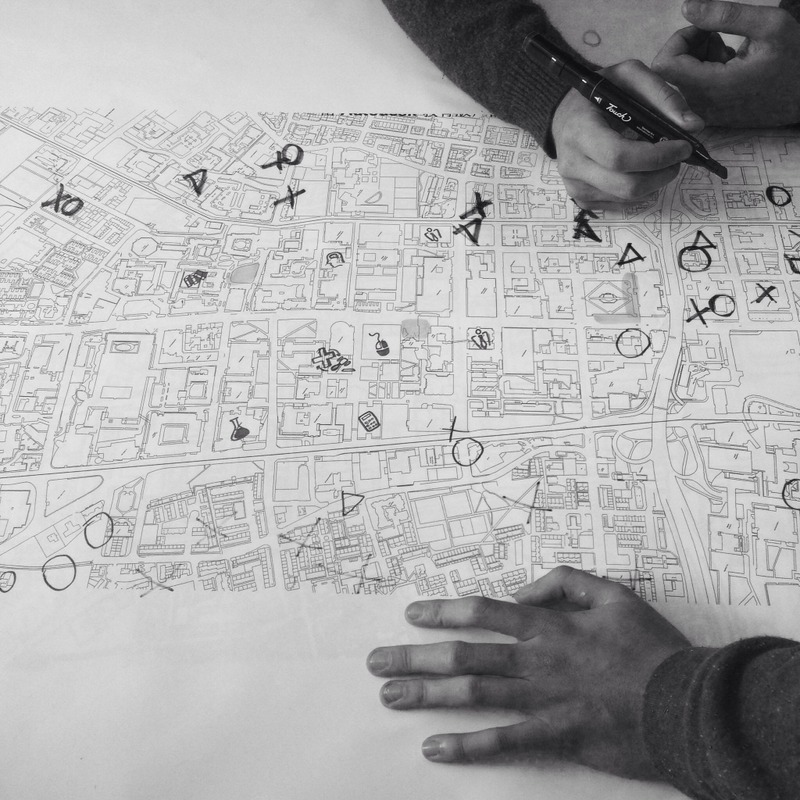
6// inputting coordinates for geolocation purposes. This helps to combine data and see which data overlaps.
Posted 13 May 2014 12:24
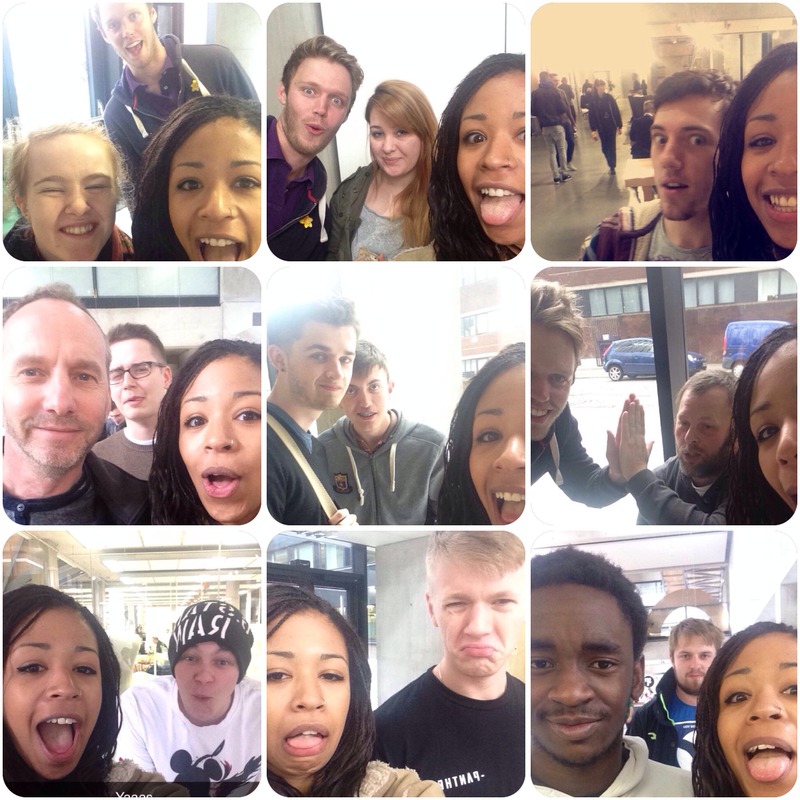
5// System dynamics. 'Take a photo with every person who stands up'
Posted 13 May 2014 12:14
4// Collaboration of all of our group's data to see which data overlaps.
Posted 12 May 2014 14:54
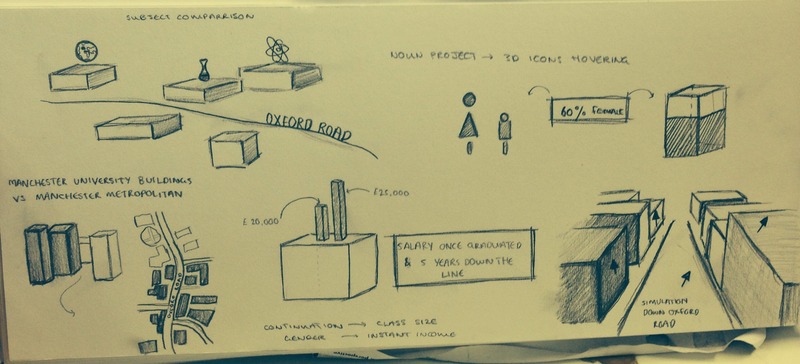
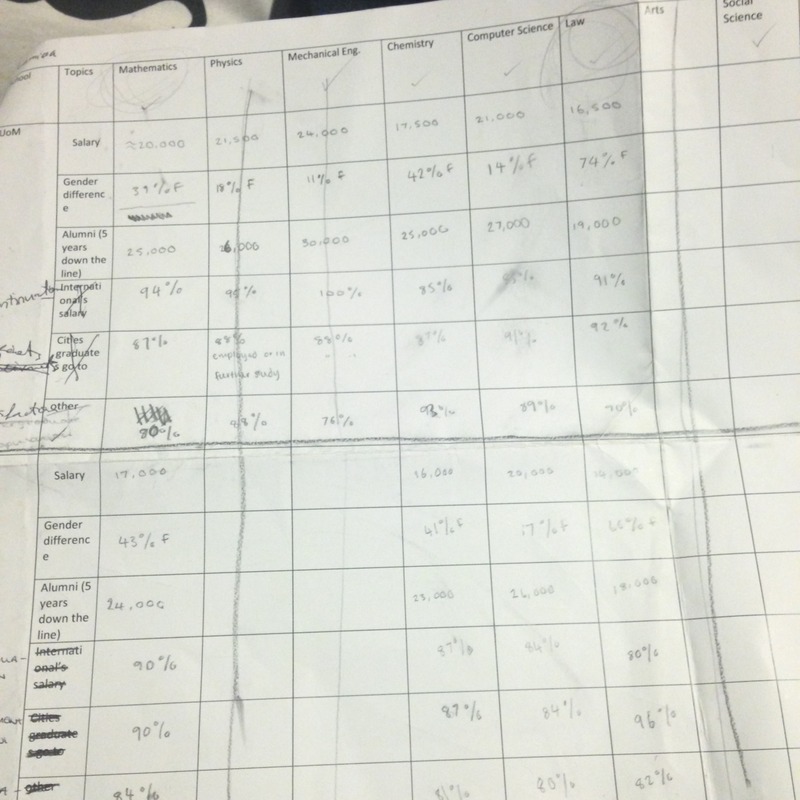
3// Visualising how we want the data to be portrayed and to which audience is important. Some examples we looked at were gender ratio (across 6 different courses), income after graduation and student course satisfaction
Posted 12 May 2014 12:22
2// Presenting data animations and interpretations.
Posted 12 May 2014 12:11
1// Collecting the data comparing the two universities was taken from various websites and spreadsheets from departments from around the University of Manchester and Manchester Metropolitan. We narrowed the comparisons down to 6 courses and chose which data we wanted to show and if it would be beneficial for the app/ students.
Posted 11 May 2014 22:07