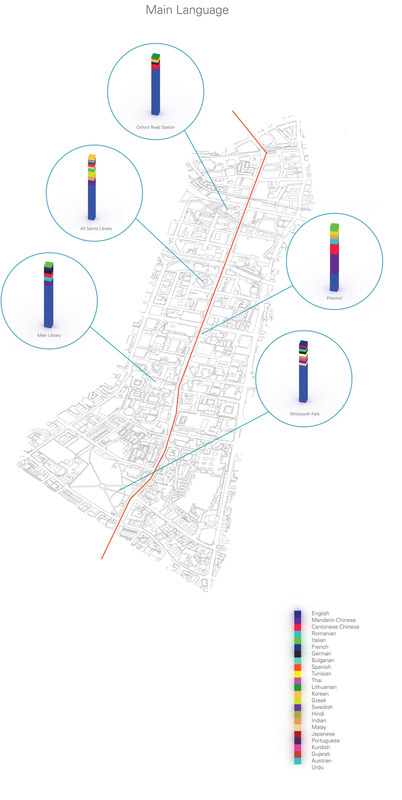
A final visualization of the main languages spoken by people on Oxford Road.
Posted 16 May 2014 19:51
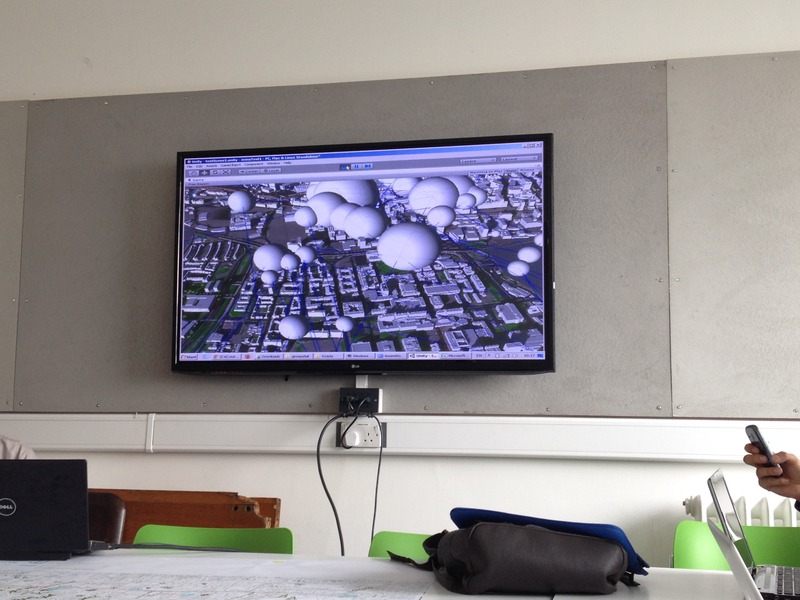
A brief look at the app in development with property prices mapped onto the Manchester city model from Arup.
In this session we participated in a series of experiments to understand the concepts of gamification and game design. Specifically we played a game where we each received a rule that reacts to the physical environment around us using the if/else statement.
Posted 15 May 2014 14:40
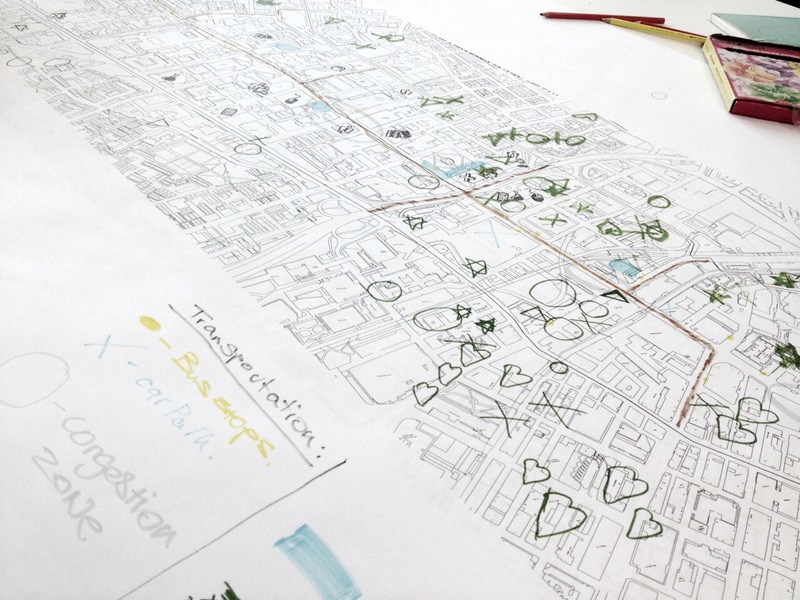
To being to put our data sets into a single app/game, each group mapped the geolocations of our data onto a single map so that we can see where they overlapped, or where correlations or links might occur.
Posted 15 May 2014 14:31
Since data obtained from the census was secondary (thus unreliable), my group went out and gathered primary data from within Oxford Road.
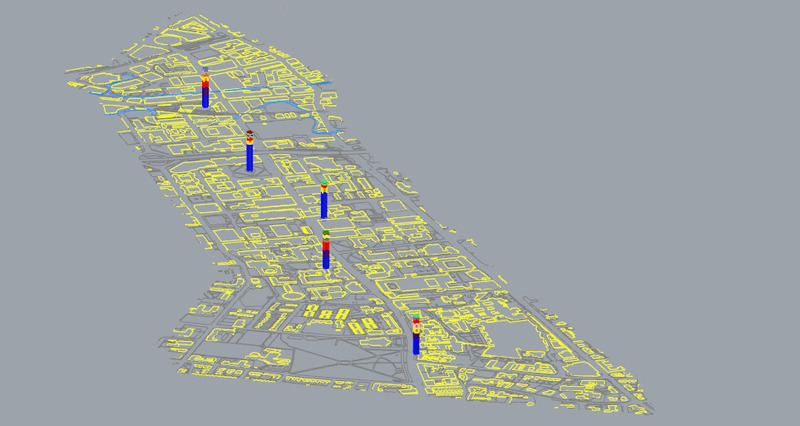
In order to make comparisons with our data, we selected several locations spread across the length of the Oxford Road corridor and interviewed a total of 250 people. Some of the questions we devised were so that we could obtain data not included in the census - e.g. their area of residence in Manchester. This would allow us to link our data to locations outside of the corridor. Above shows the data of 'other languages spoken' mapped as a percentage bar chart at their specific location.
We also managed to get a set of data on the nationalities of students in the University of Manchester, but these were omitted later on as they were secondary.
Posted 15 May 2014 14:17
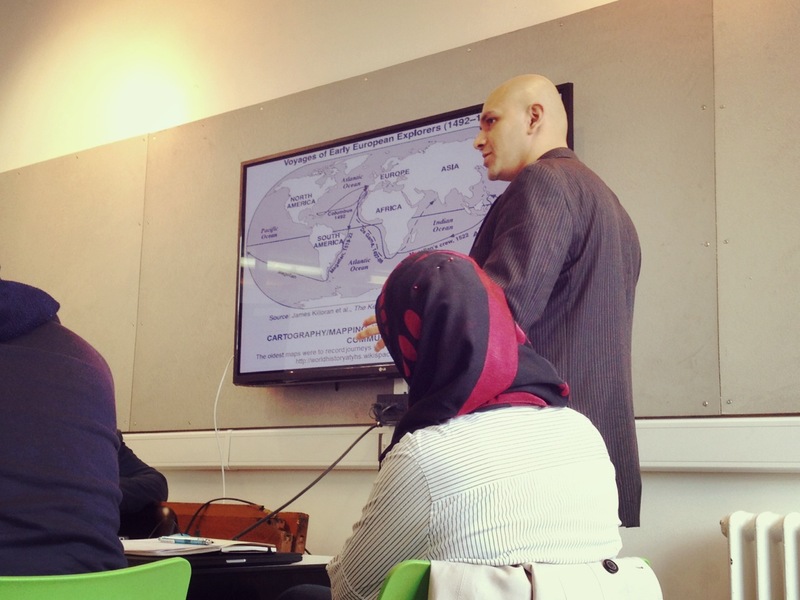
In the second session Ulysses gave us a brief presentation on the spatialization of data i.e. mapping and the consequences of this on design. Different methods of mapping data such as Nolli maps, mindmaps and etc are introduced.
Posted 15 May 2014 14:06
Session 1 introduced us to the idea of 'Big Data' and the use of such data in the development of design. We were given some time to choose a topic to gather data on within Oxford Road, and my group collectively decided to investigate nationality and languages spoken by people on Oxford Road.
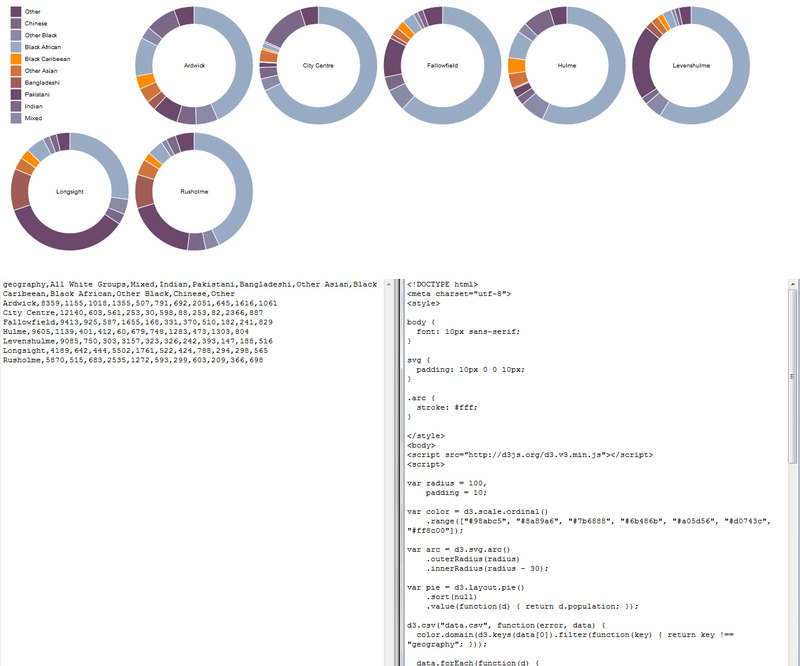
After the session I gathered relevant data from the 2011 Census on 'Main Language Spoken' and 'Ethinicity' (as there was no data on Nationality available) in the wards within Oxford Road.
With this data I experimented with D3 (Data Driven Documents) - a javascript library that turns data into visualization. The above image shows the data, code and outcome.
Posted 11 May 2014 12:34