Our app is finally done!!! Today we could play around with the app that includes all the information that we have gathered over the past few days. So exciting and interesting !!
Posted 16 May 2014 16:41
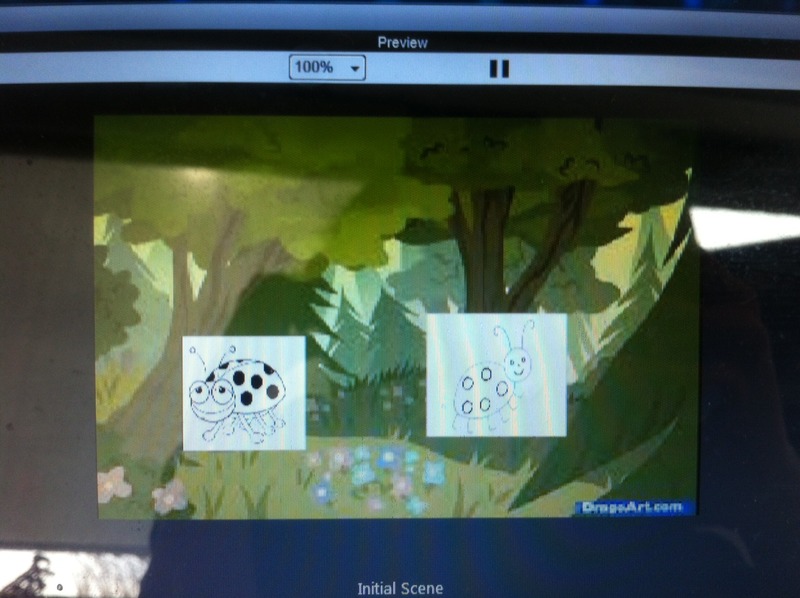
Today we learned how to use Salad Game, which allows you to create simple games in a very easy way. The idea was to explore new programs and ideas that will be useful in the future. It helped us understand the process of making an app and how to apply rules with the "If...Else" method.
Posted 16 May 2014 16:40
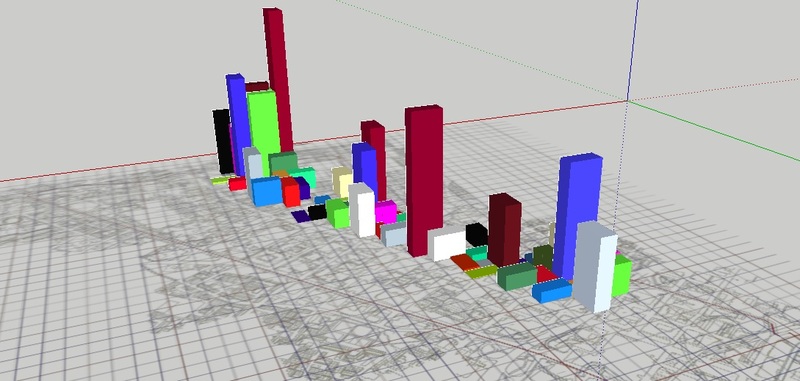
We are now putting all the information together from all different groups to find the relation between our data. For example our age groups data can be highly related with the renting price data and how students tend to live in cheaper areas rather the most expensive ones.
Posted 13 May 2014 14:24
We have gtahered all the information from two different cesus: The newest one and the one before Manchester Victoria University and UMIST joined together.
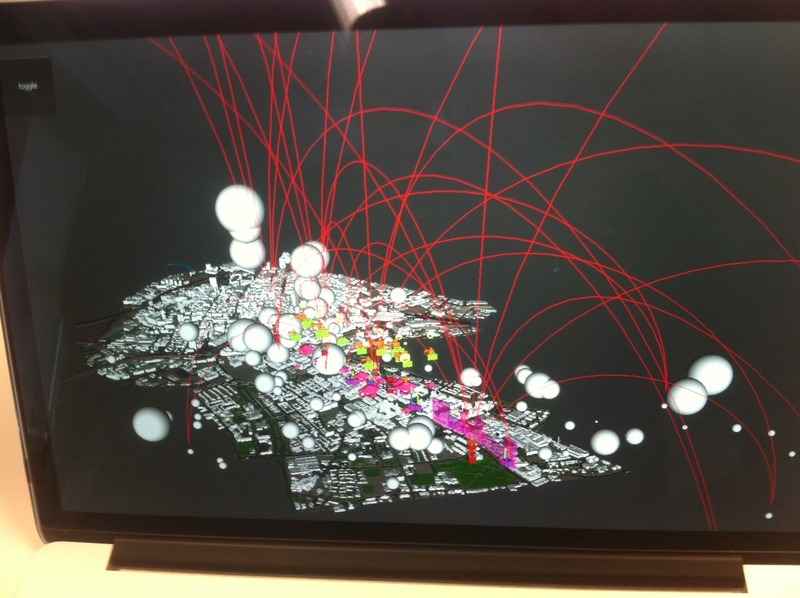
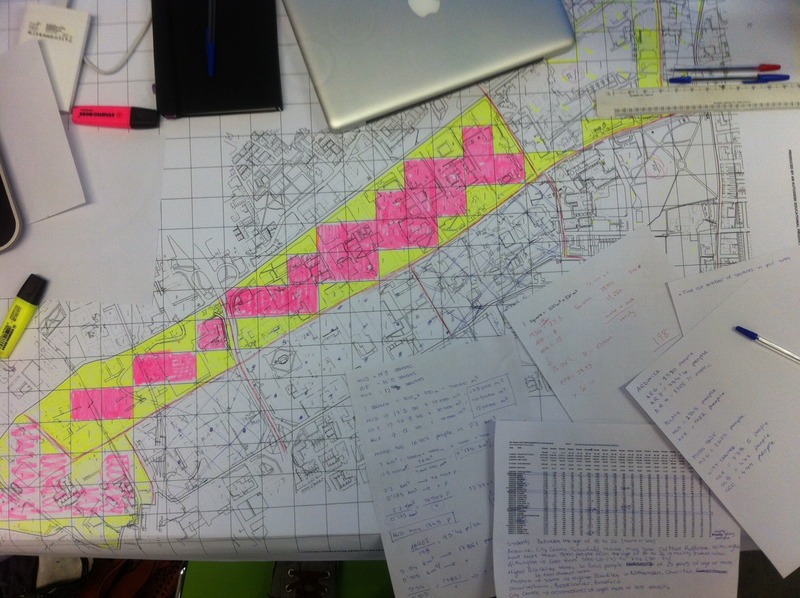
We are now mapping all the information and looking at the concentration of students at different times and districts.
Posted 13 May 2014 14:16
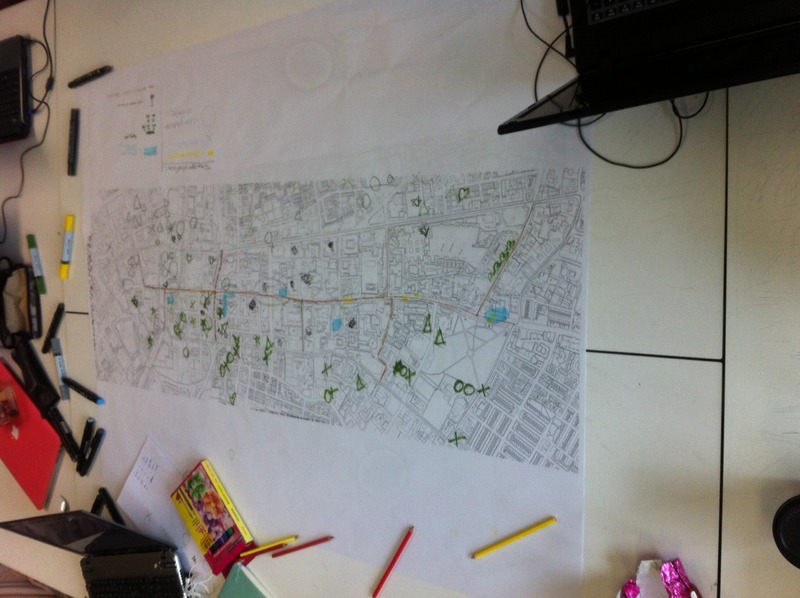
For our mapping research we wanted to get as much detailed information as we could. We found information about all the districts needed but we wanted to know the distribution in the sub districts of the area. To do so, we created a grid and investigated the number of people that lived in a hectare of each district to finally obtain all the data we wanted. Next step: Mapping the data.
Posted 8 May 2014 16:30
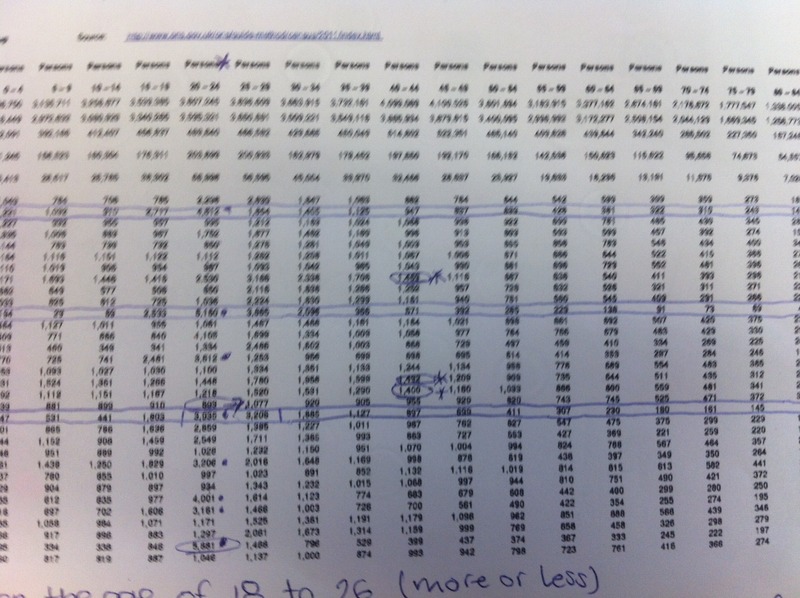
Ulysses Segupta showed us and explained us examples of what we were about to do. He also advised us on our research and decided to observe the concentration of students living by Oxford Road. We finally analysed a census from 2011 to understand how the different groups of ages gather in different areas and why.
Posted 8 May 2014 16:25