Playing with final app on last day.
Posted 16 May 2014 14:46
First view of the app with icons and animations.
Posted 16 May 2014 11:56
Introduction to game making website " Game Salad". The website allows users to make simple games using the "If Else" rules.
Posted 16 May 2014 11:53
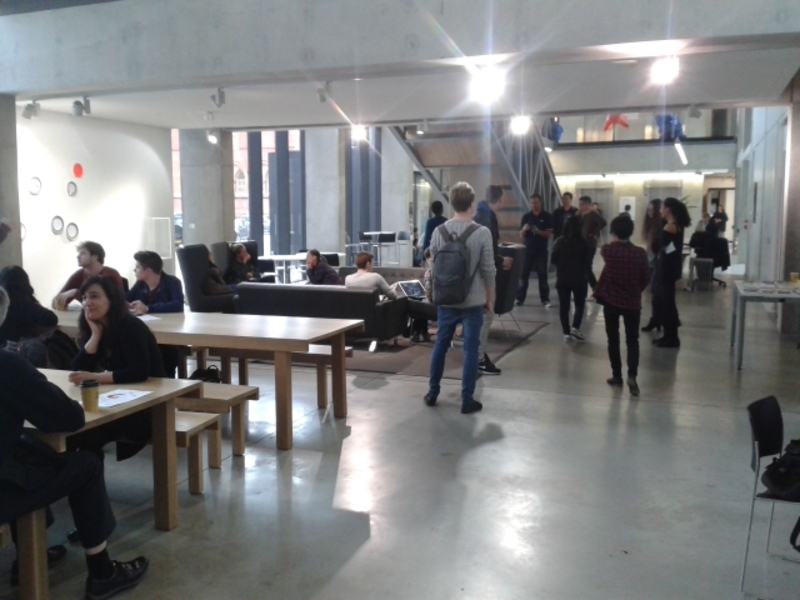
Day 6 - Introduction to "System Dynamics. The main aim of the session was to introduce the group to the basics behind game design. We had to individually come up with an "If Else" statement for another person. This statement basically meant "If" a certain thing happens an action should be made, "Else" if a certain action should be made till there is an "If". This activity took place in the cafe.
My "If Else" statement -
"If" - A person wearing glasses talks you have to walk over and stand next to them.
"Else" - Walk around looking at the floor.
Posted 16 May 2014 11:50
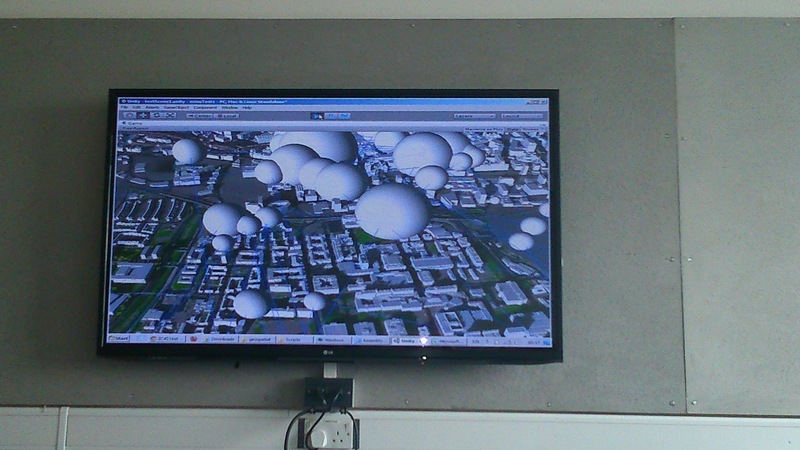
First look at our app, showing the linked data over the 3-D model of Mnachester.
Posted 14 May 2014 09:56
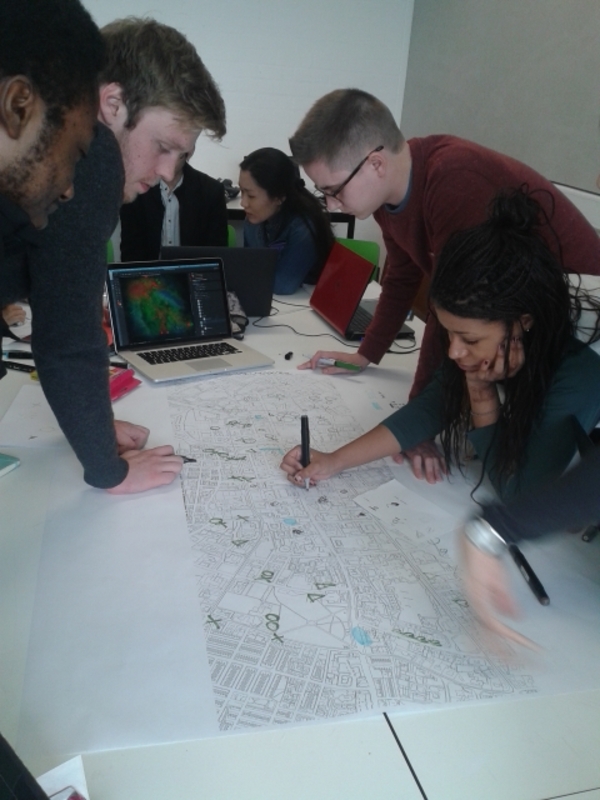
Day 5 - We then began to work out the relationship between the different groups data. Collaborating this data allowed us to see which information overlapped. This map was then used to begin the programming of the app.
Posted 14 May 2014 09:52
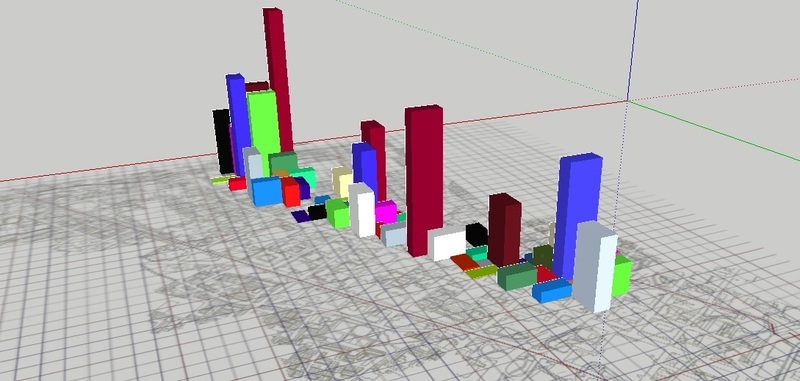
Day 4 - With our data we then tried to represent this in a 3-D way visually using a Google SketchUp model. With different colours representing different age groups, the height of the towers represent the density of that particular age in that district.
Posted 14 May 2014 09:43
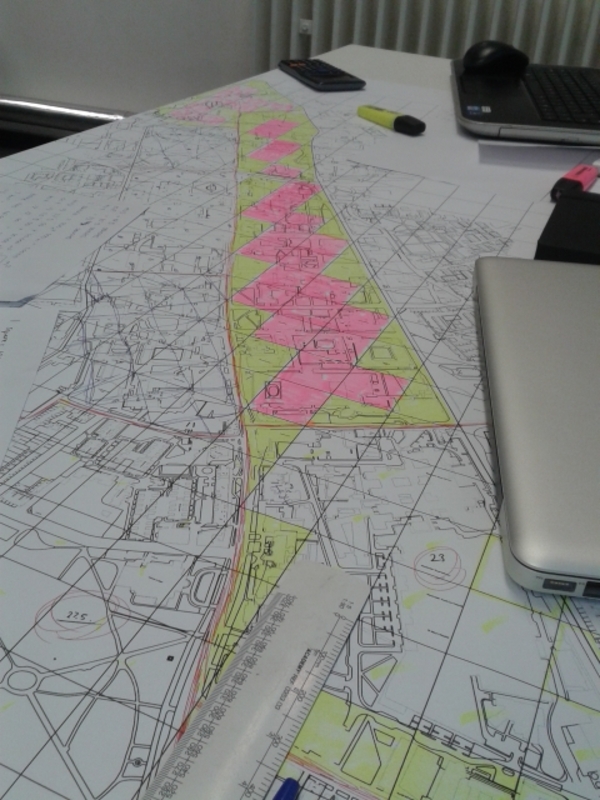
Day 3 - To then calculate the density of people in the sub districts we created a grid system which was placed over a map of Oxford Road. We worked out the hectare area for each individual district with the grid system. We could then, using a calculated estimation, work out the density of each age group in different areas.
Posted 14 May 2014 09:32
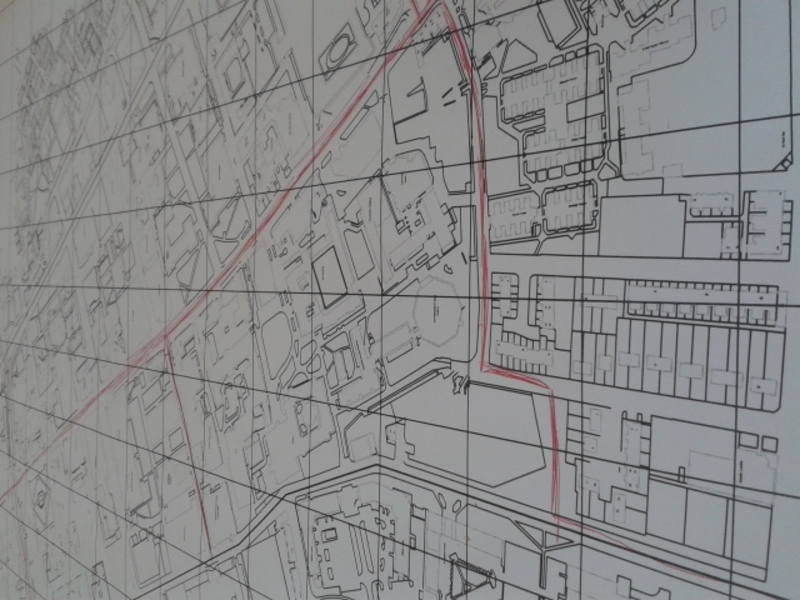
Day 2 - After finding data we then needed to relate this to a map. To make our data smaller and more accurate we divided the four different wards we were looking at and had data for, into their sub districts.
Posted 14 May 2014 09:21
Day 1 - As a group we chose to look at the age population down the Oxford Corridor. Through this research we wanted to find out the percentage of students living in each district in comparison to other ages. We could then compare this data to the locations of the universities.
Posted 12 May 2014 09:31
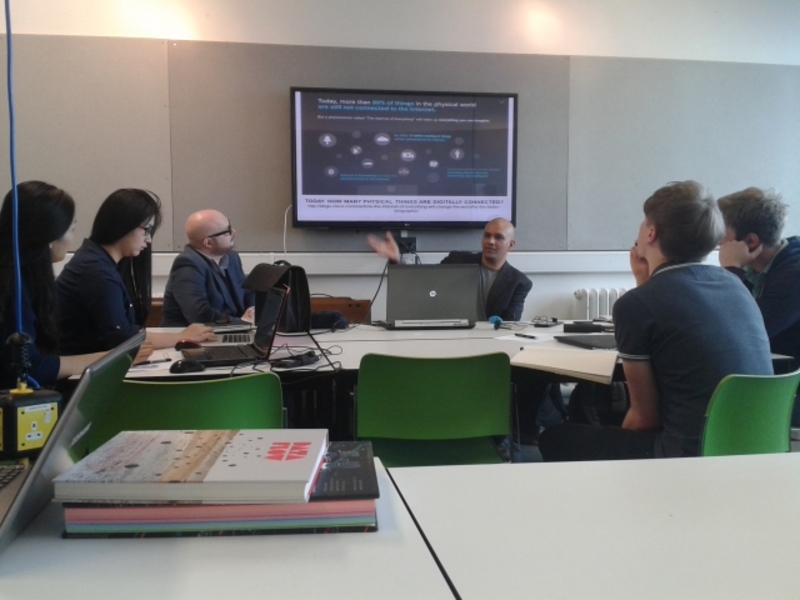
Day 1 - Presentation given introducing group to big data. The presentation showed the group how to collect such data, how to record it and then how to represent it in a way where it can be read visually.
Posted 12 May 2014 09:22