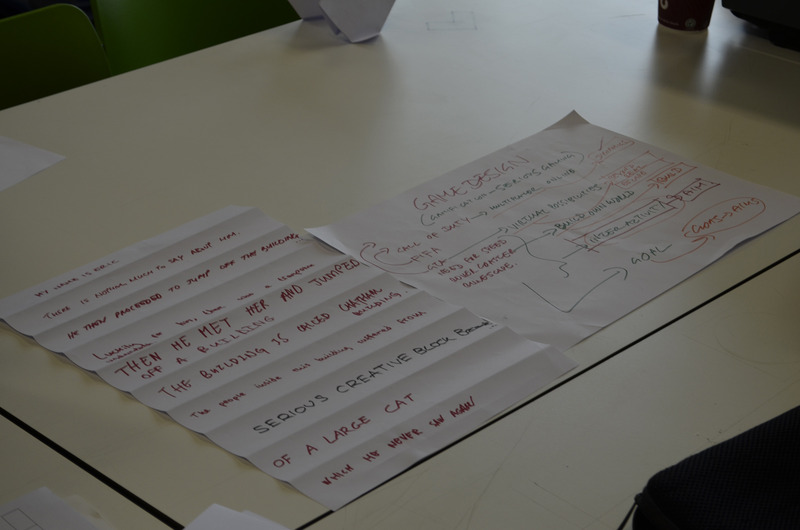
Working once again with Ullyses, we undertook a workshop which developed our understanding of what makes a 'game', so that this analysis could influence the final output of the Event.
Posted 14 May 2014 12:28
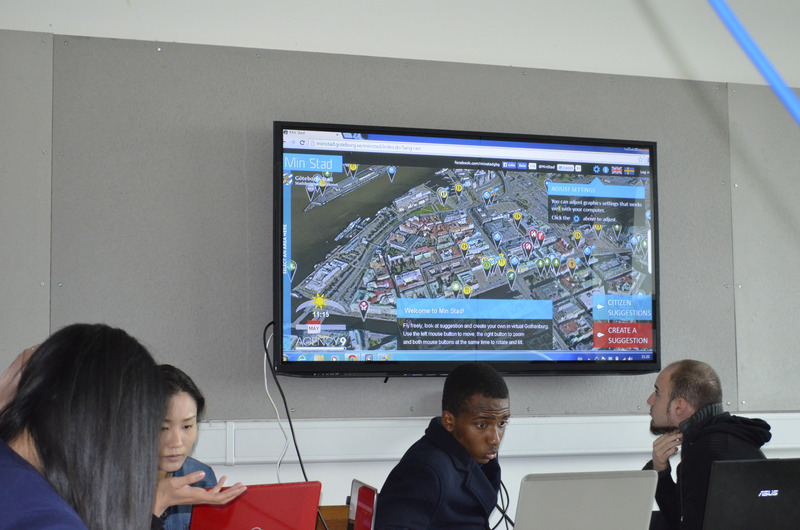
After meeting with our collaborator, Eric from Arup, we began to be able to see what our mapped data would look live visualised and geolocated within a 3D model of the Oxford Road corridor.
Posted 14 May 2014 12:27
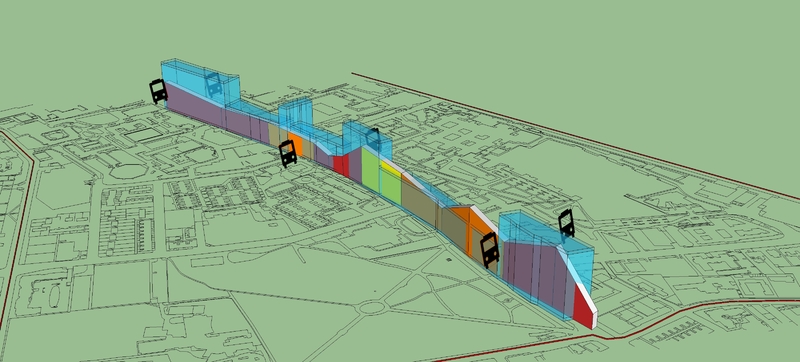
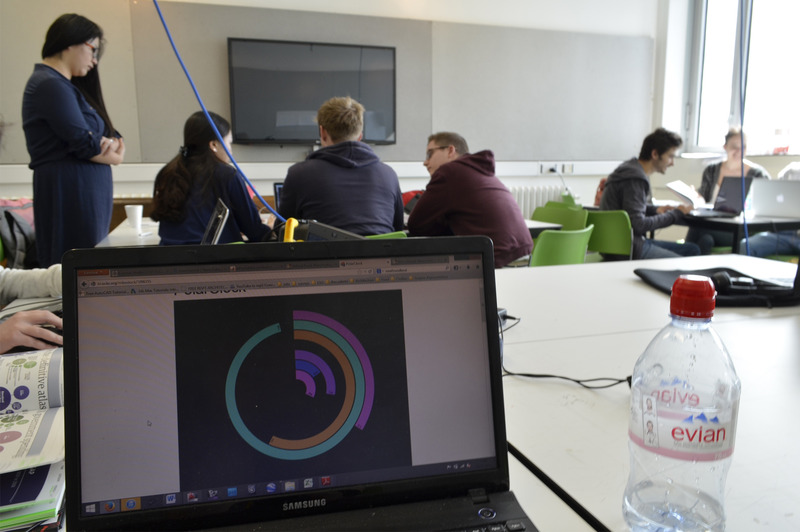
After gathering our data, we began to develop ways in which we could visualise it in a three dimensional model. In this image, information regarding congestion and traffic flow has been mapped.
Posted 12 May 2014 13:28
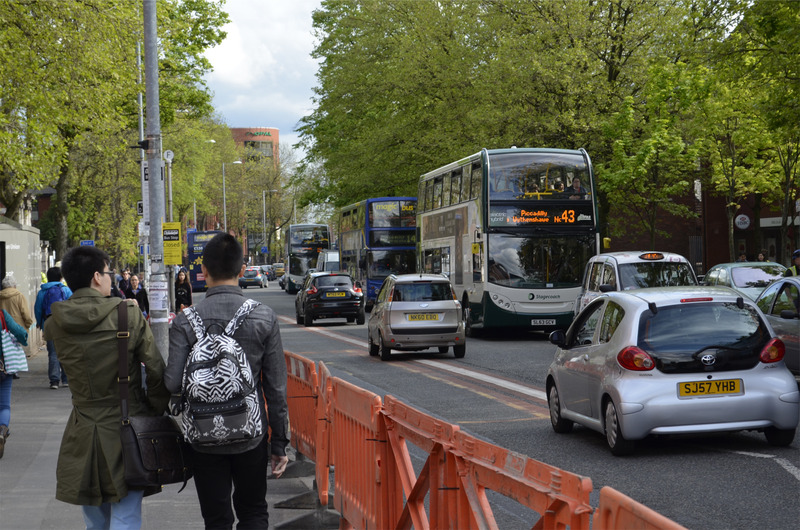
After feedback from the fifth year students, we went back onto oxford road to gather more data regarding transport, looking at areas such as traffic flow and congestion. This photograph was taken outside the Manchester Royal Infirmary building.
Posted 9 May 2014 15:13
After a lecture from Ulysses Sengupta regarding ways in which we can map and visualise data, we spent the day discussing out findings with the fifth year students, and proposing how we would develop our process. We also looked at precedents regarding types of graphic representation.
Posted 9 May 2014 15:11
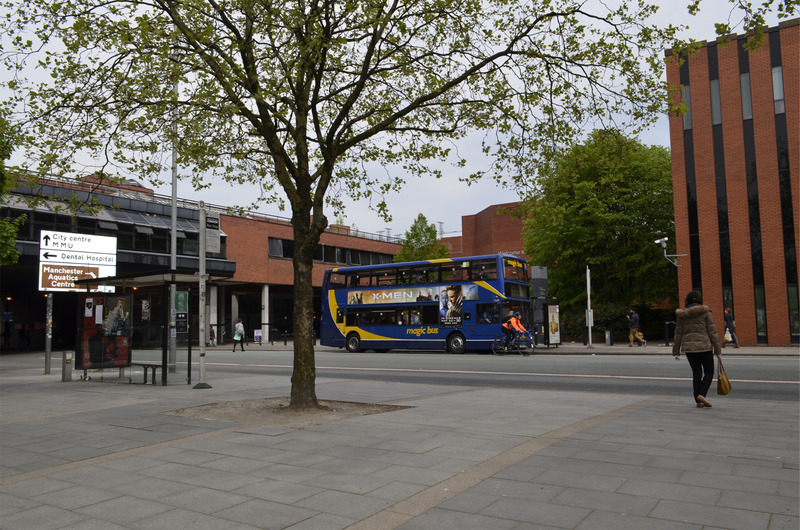
On the first day, we were split into smaller groups that would focus on different areas of information to map along Oxford Road. Our team was focusing on transport, I chose to map data and statistics regarding bus stops, the one pictured is opposite University Place.
Posted 9 May 2014 15:09