3D visualisation of property pricing using photoshop and sketchup.
Posted 13 May 2014 22:24
First view of the app with just data and no animation.
Posted 13 May 2014 17:33
Geographically mapping data onto oxford road to start the apps programming.
Posted 13 May 2014 17:32
We are now putting all the information together from all different groups to find the relation between our data. For example our age groups data can be highly related with the renting price data and how students tend to live in cheaper areas rather the most expensive ones.
Posted 13 May 2014 14:24
We have gtahered all the information from two different cesus: The newest one and the one before Manchester Victoria University and UMIST joined together.
We are now mapping all the information and looking at the concentration of students at different times and districts.
Posted 13 May 2014 14:16
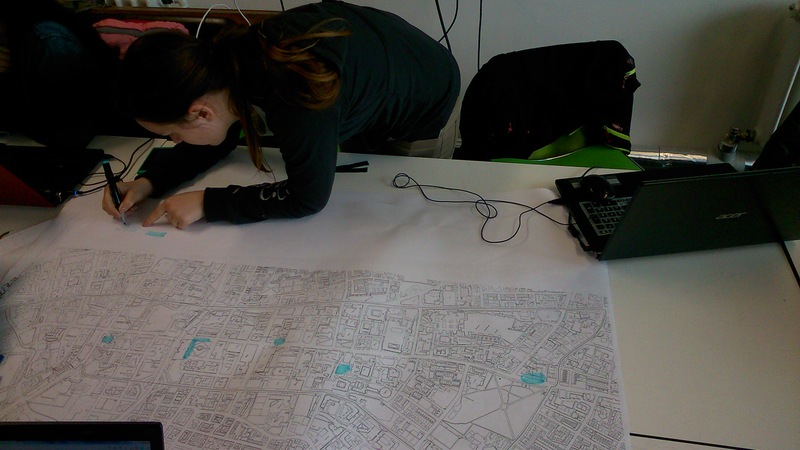
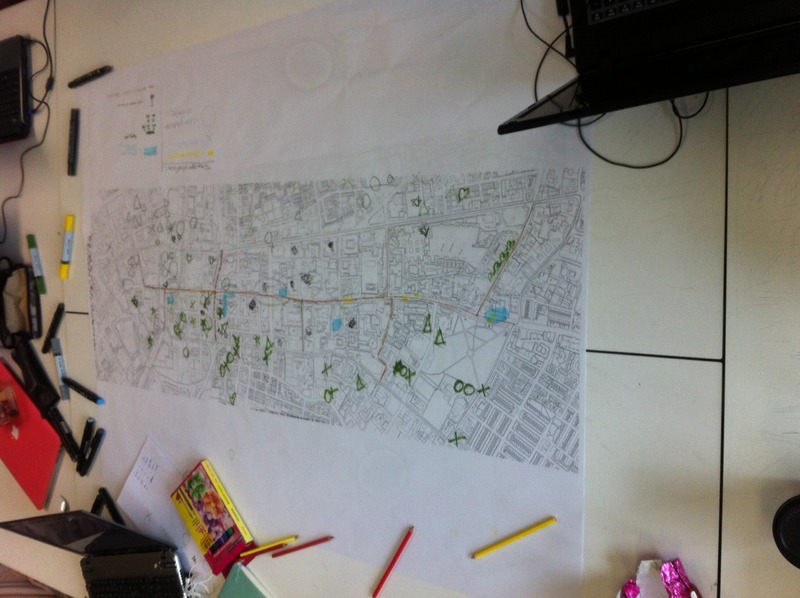
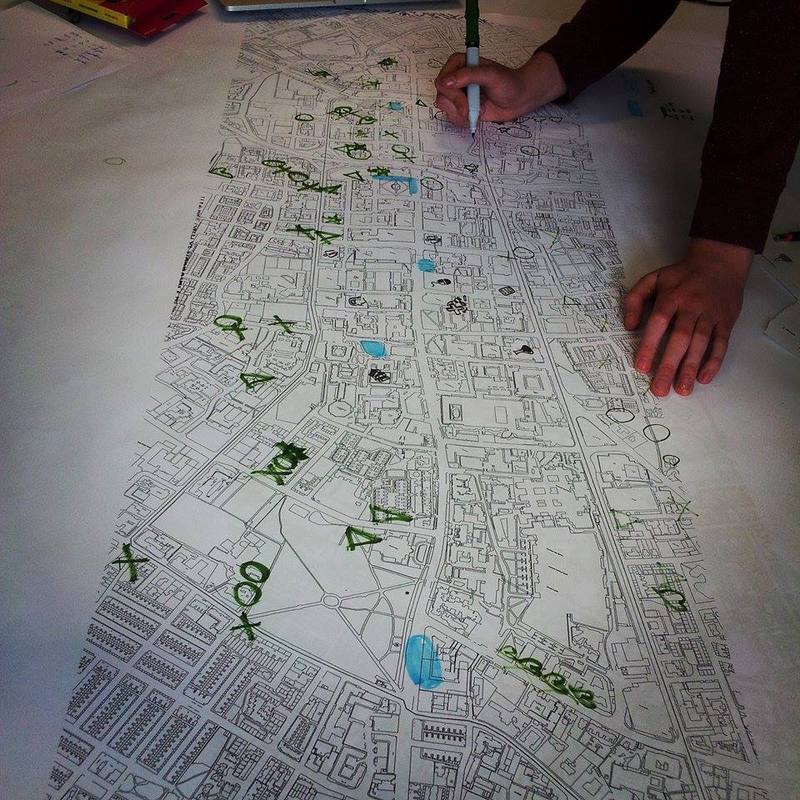
More cartography precedence...
Posted 13 May 2014 13:51
More cartography precedence...
Posted 13 May 2014 13:51
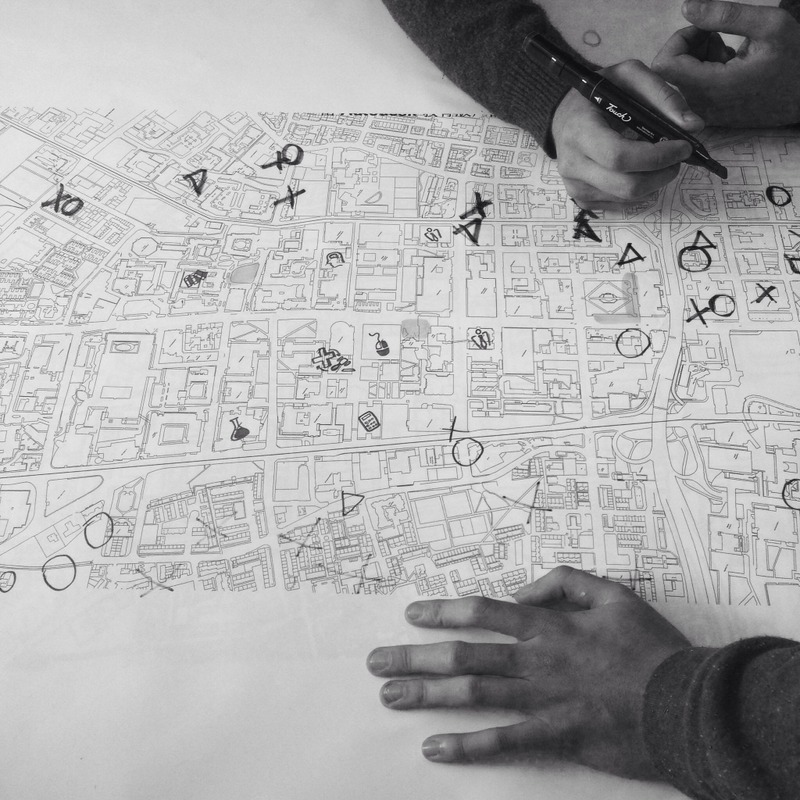
What cartography to represent our nationality & first and second language data with. Some precedence that has shaped our design.
Posted 13 May 2014 13:51
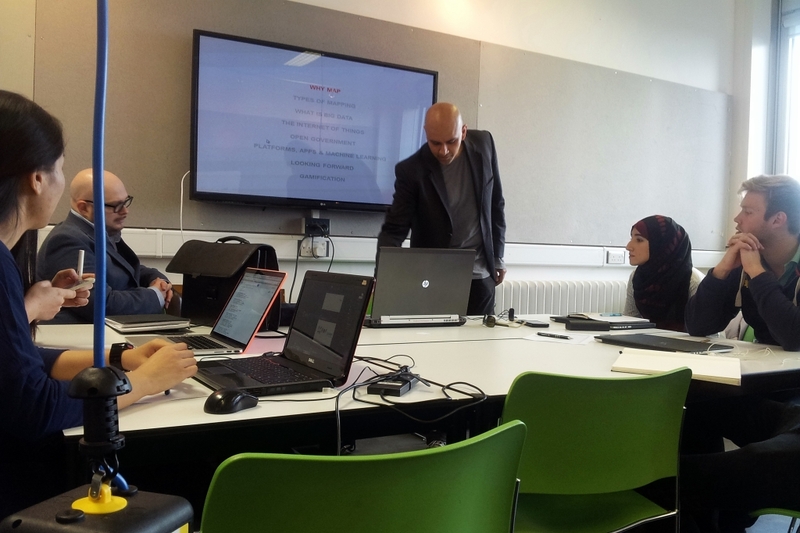
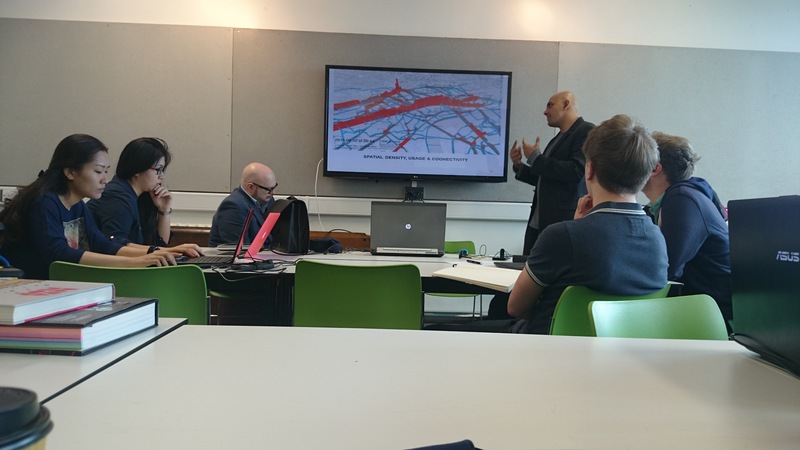
Introduction to data city, one of the main focuses Cartography.
Posted 13 May 2014 13:46
6// inputting coordinates for geolocation purposes. This helps to combine data and see which data overlaps.
Posted 13 May 2014 12:24
5// System dynamics. 'Take a photo with every person who stands up'
Posted 13 May 2014 12:14
12/05/2014
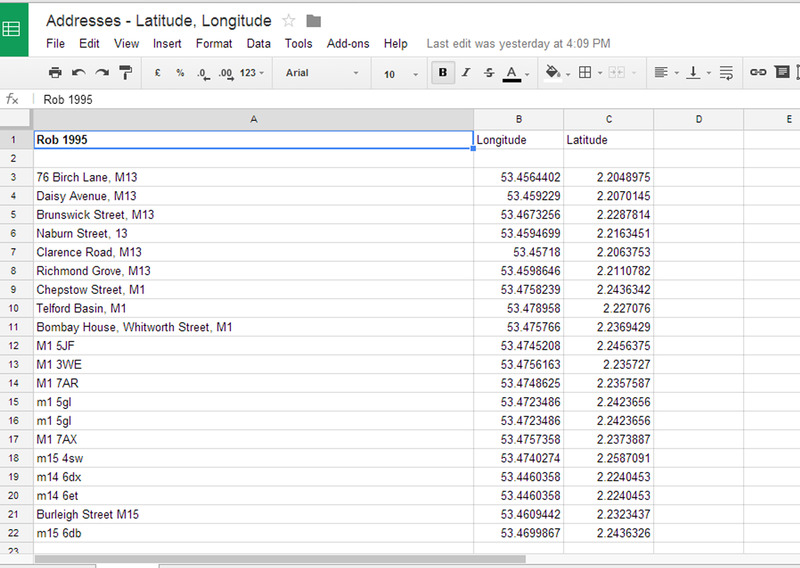
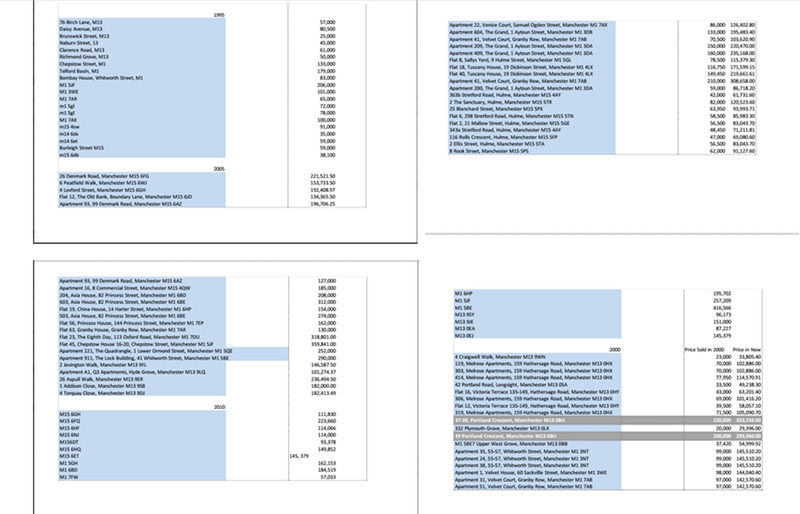
Final data set. I have added in Longitude and Latitude figures for the addresses in each year. This was necessary information for the app development. The initial idea is for there to be a slider on the app, which will display the different years of property pricing.
Posted 13 May 2014 01:22
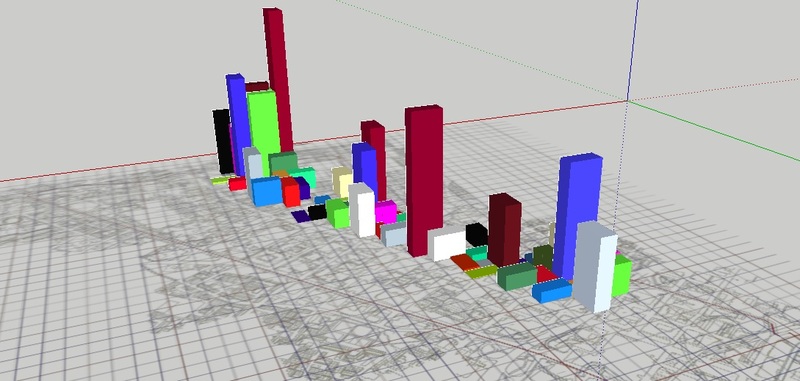
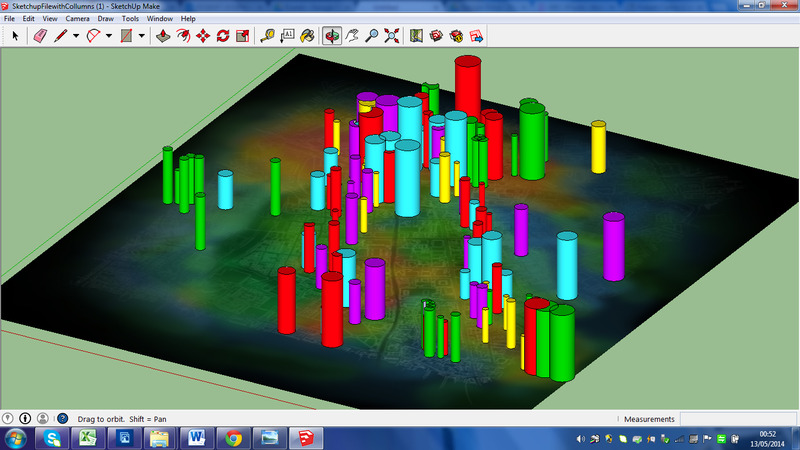
12/05/2014
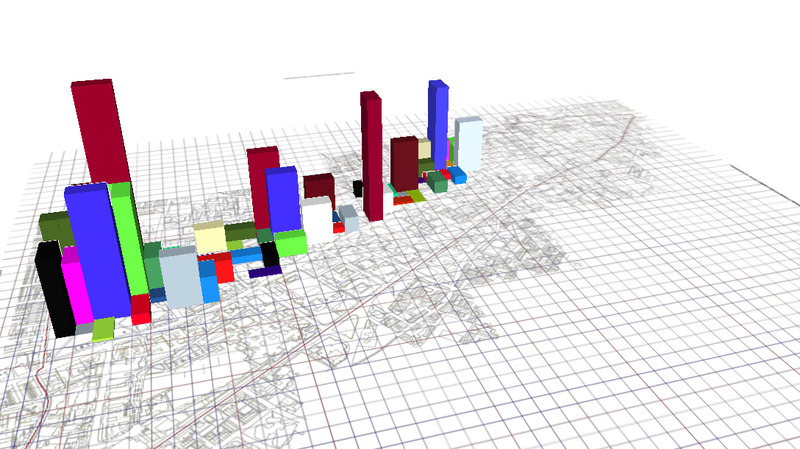
This 3D Sketchup model follows the same idea as before, with varying sized circles showing prices of different years. The simple difference being that the circles have been made taller to exaggerate any trends. It also ties in well with the other groups who have made 3D models of their data sets using Sketchup.
Posted 13 May 2014 01:16
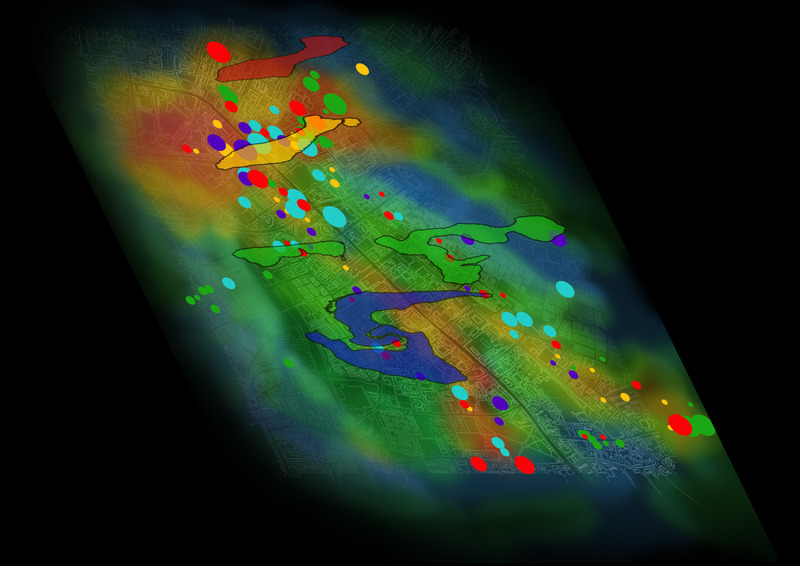
09/05/2014
An idea of having zones marked on the map to indicate pricing. We felt this didn't work as well as another form of 3D visualization could.
Posted 13 May 2014 01:06
07/05/2014
This was the price map layer we used for our map. It shows the overall trend of the area in regards to wealth, via a heat map effect (Red is the most expensive, blue the least).
Posted 13 May 2014 00:20
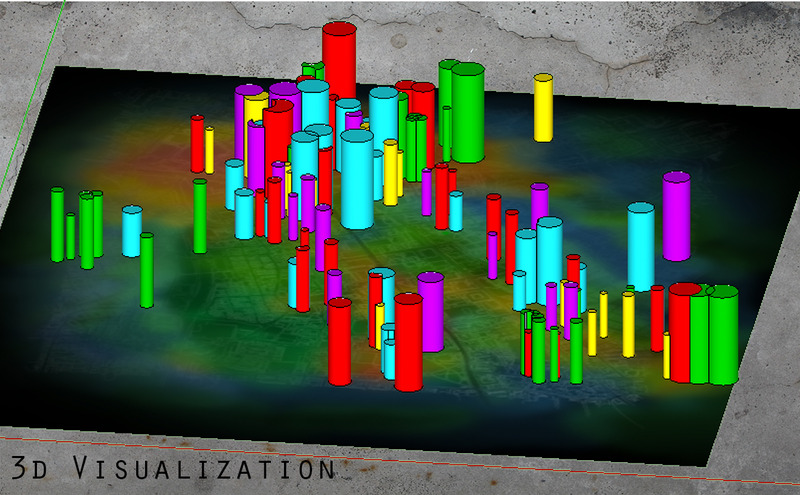
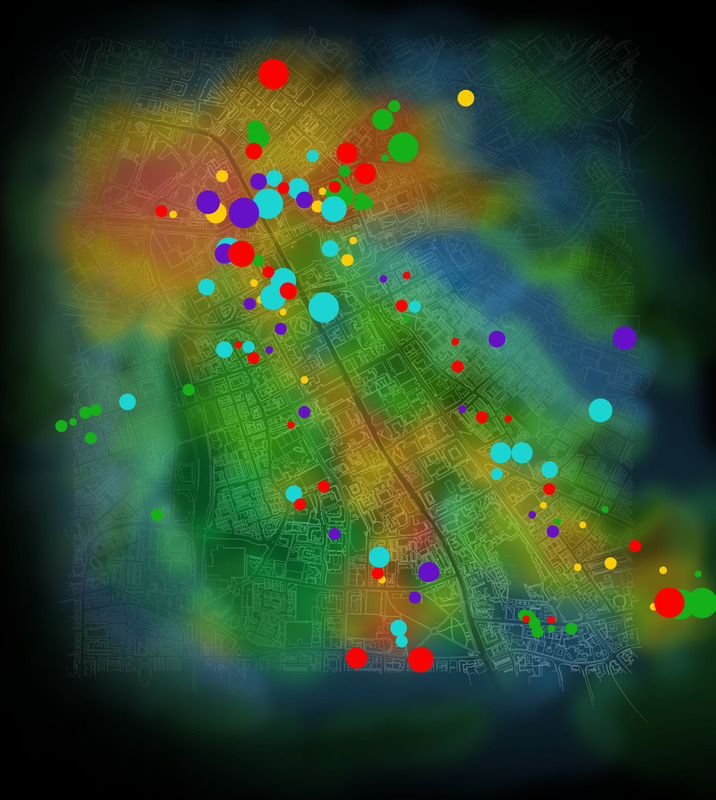
07/05/2014
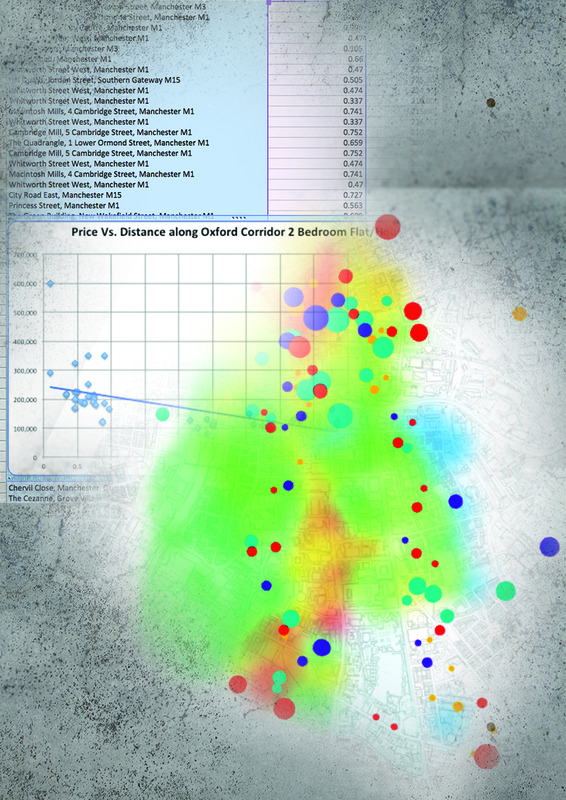
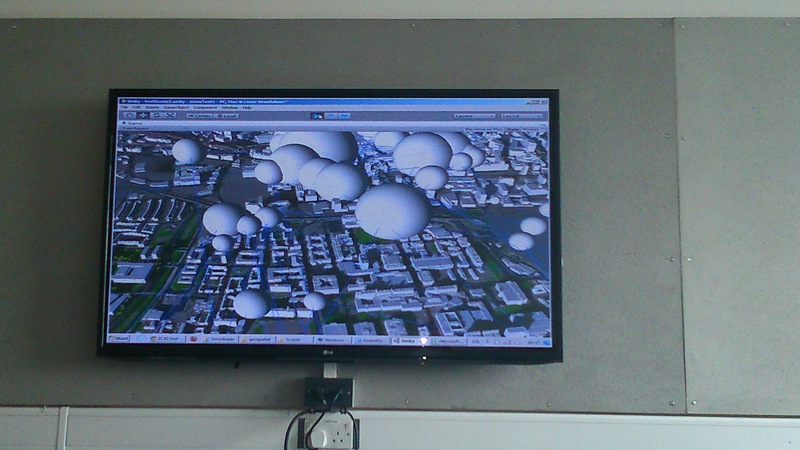
This map shows the difference in property prices over time. The different years are shown by the range of colours (Red-2014, Purple-2010, Aqua-2005, Green-2000, Yellow-1995). The varying size of the circles is in relation to the price of the property, with the bigger the circle being the more expensive the property. This was done by picking a certain pixel per price range (0-50,51-100,101-150,151-200,201-250,251-300,300+).
Posted 13 May 2014 00:13
06/05/2014
We had a group discussion in the morning, which resulted in the decision to not include areas that deviated too far from Oxford Road. This disregarded a main source of our initial data (Fallowfield), resulting in new data points being needed. We focused then on gathering data points from 1995, 2000, 2005, 2010 and 2014 which just focused on price.
Posted 12 May 2014 23:58
05/05/2014
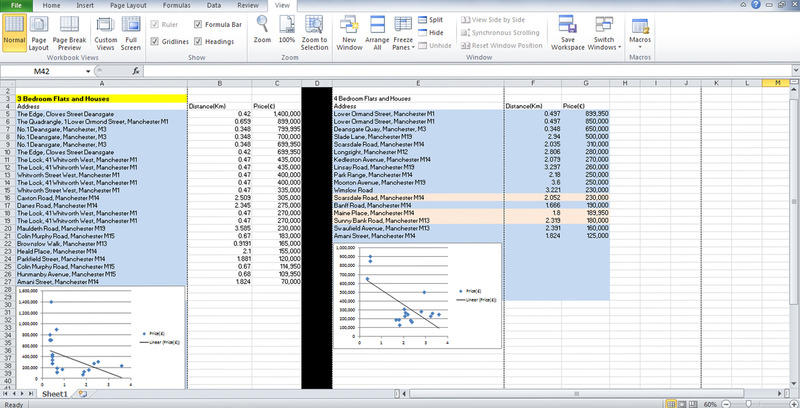
We divided into sub-groups and specified which data would be of interest for us to collect. My group decided upon Property prices around Oxford Road. This Excel spreadsheet was the first set which I gathered (Focusing on 3 and 4 bedroom flats and houses). The other two group members collected data on 1/2 bedroom properties, along with rented buildings.
Posted 12 May 2014 23:40
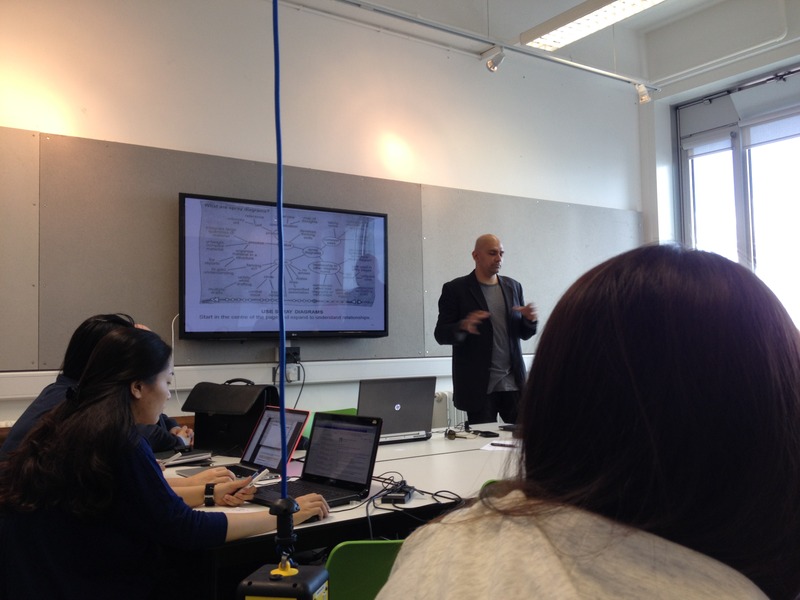
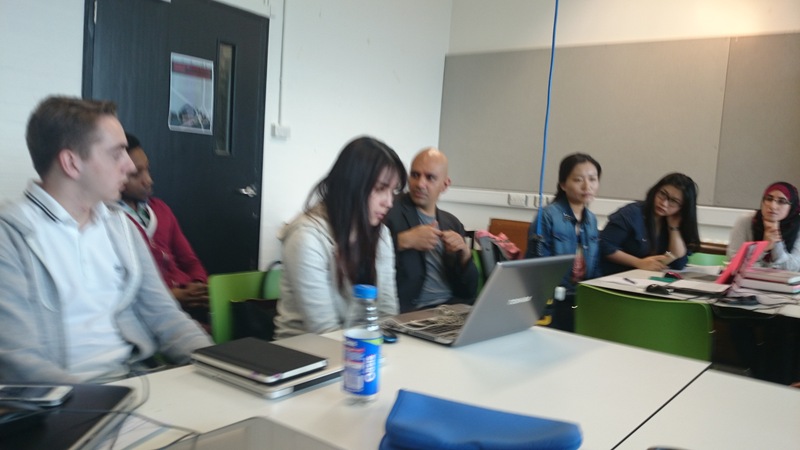
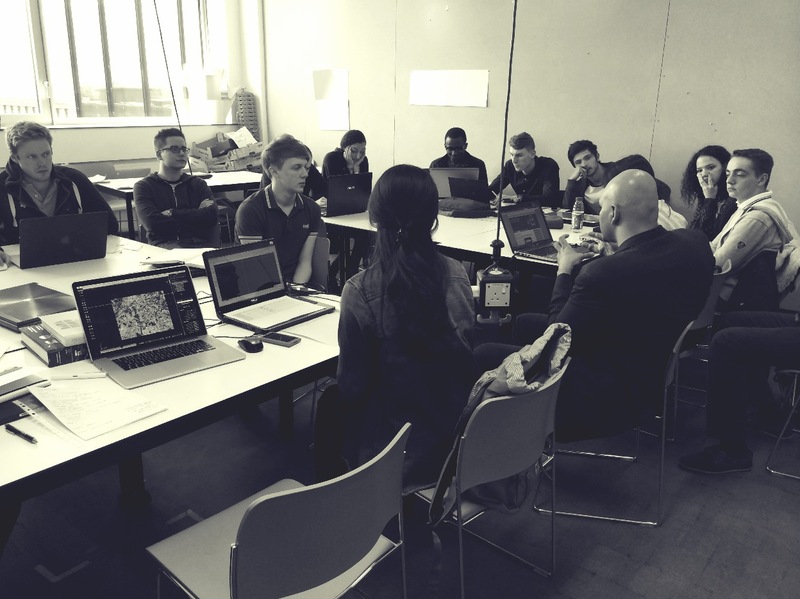
Productive Group Discussion
Posted 12 May 2014 15:15
Master Data Map
Posted 12 May 2014 15:03
Abstract Data Map
Posted 12 May 2014 15:03
4// Collaboration of all of our group's data to see which data overlaps.
Posted 12 May 2014 14:54
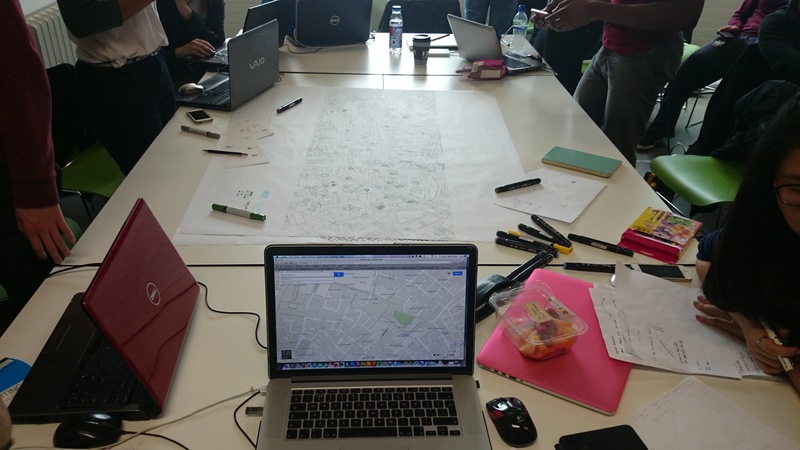
We gathered data of all the other groups into one to be able to figure out how all of them may link to each other. Next step is trying to visualize them working all together on the app.
Posted 12 May 2014 14:51
Group data mapping collaboration
Posted 12 May 2014 14:51
Group - Mapping Data to large site
Posted 12 May 2014 14:33
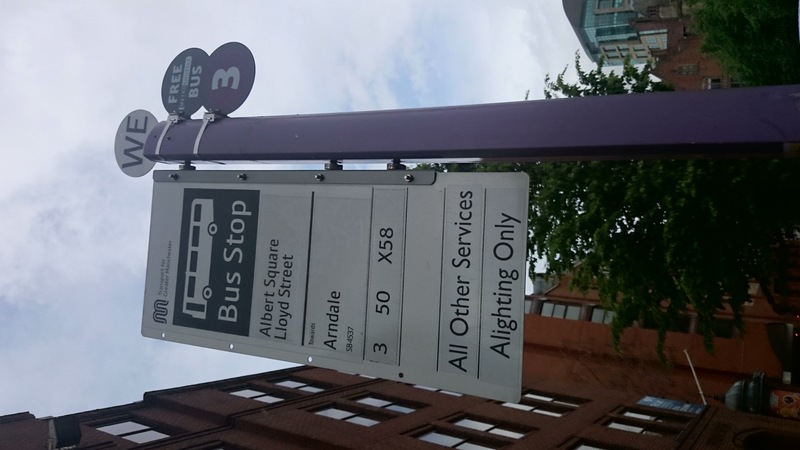
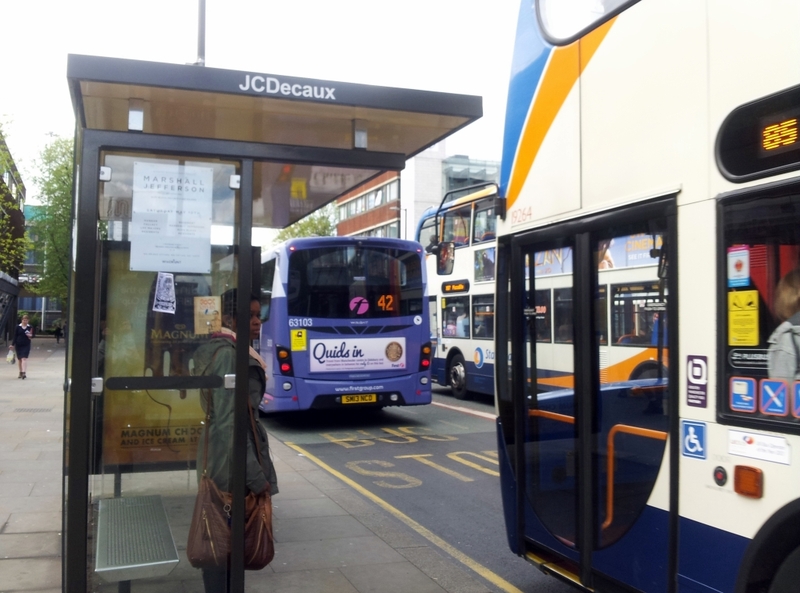
Bus stop sign - Data
Posted 12 May 2014 14:21
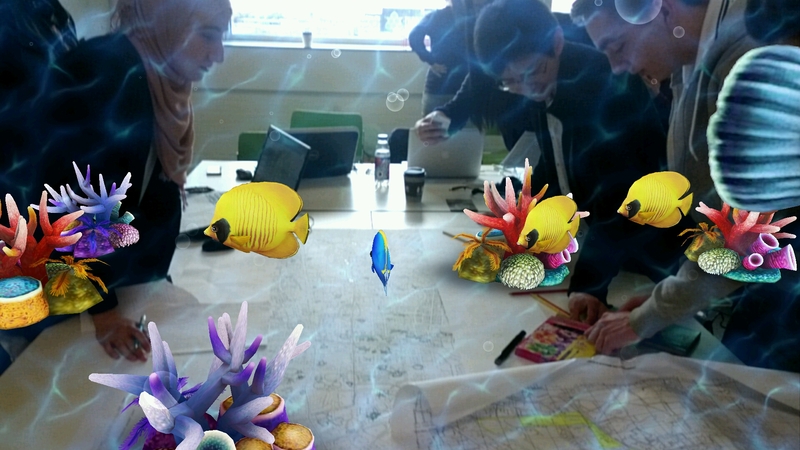
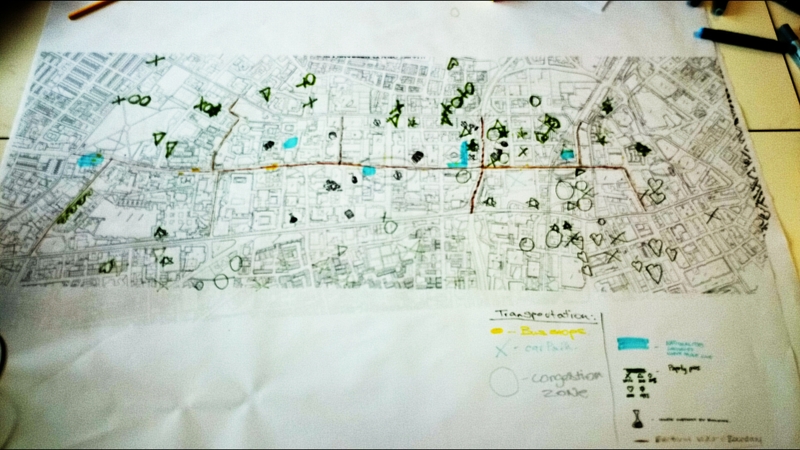
Data Mapping - transportation - Diagram #redbullgivesyouwings
Posted 12 May 2014 14:20
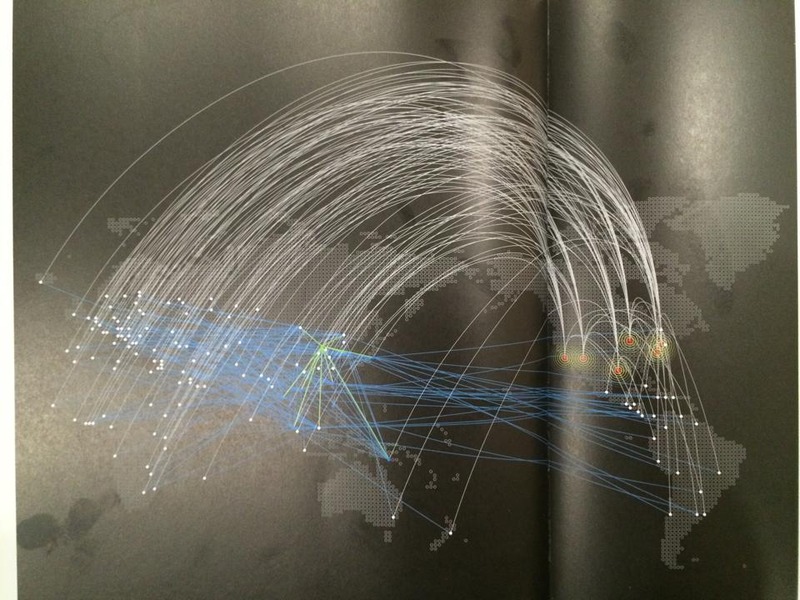
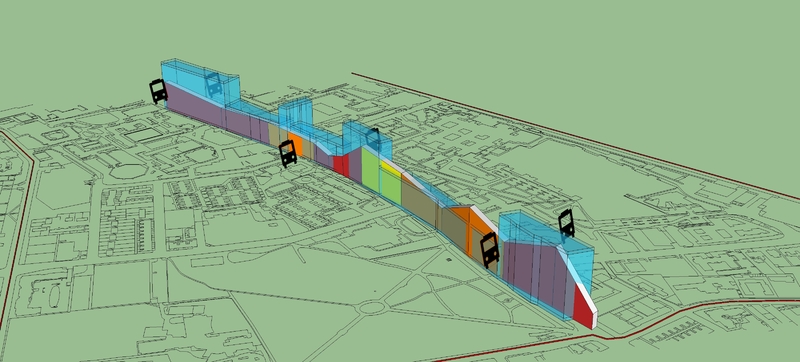
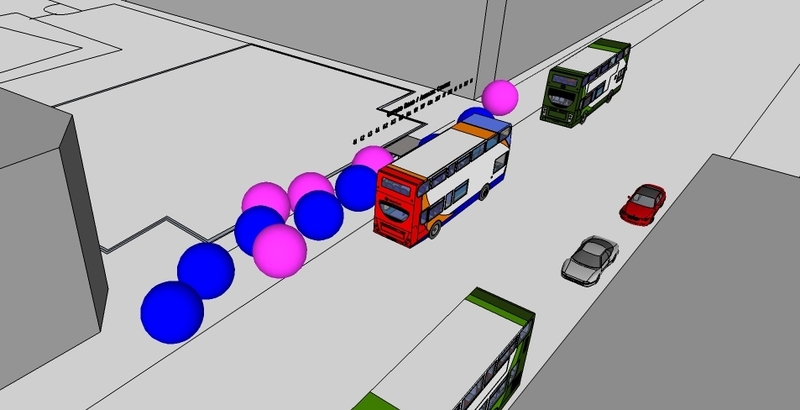
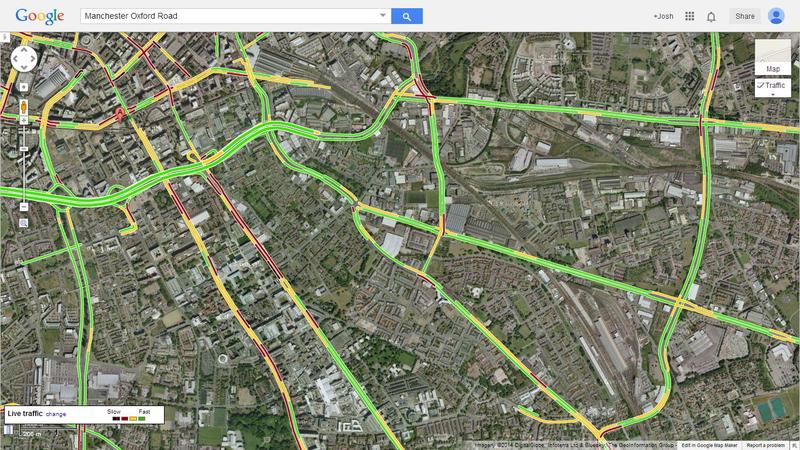
After gathering our data, we began to develop ways in which we could visualise it in a three dimensional model. In this image, information regarding congestion and traffic flow has been mapped.
Posted 12 May 2014 13:28
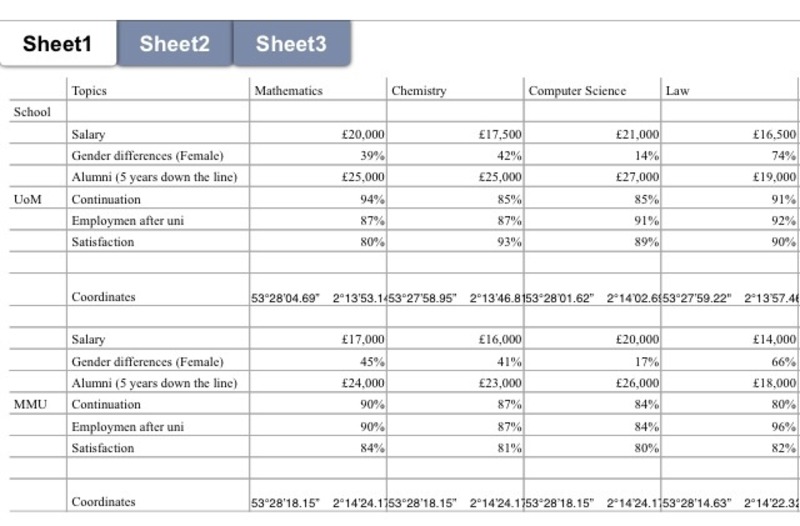
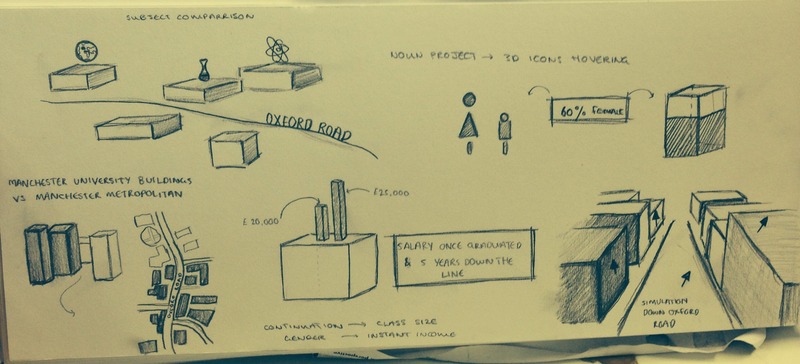
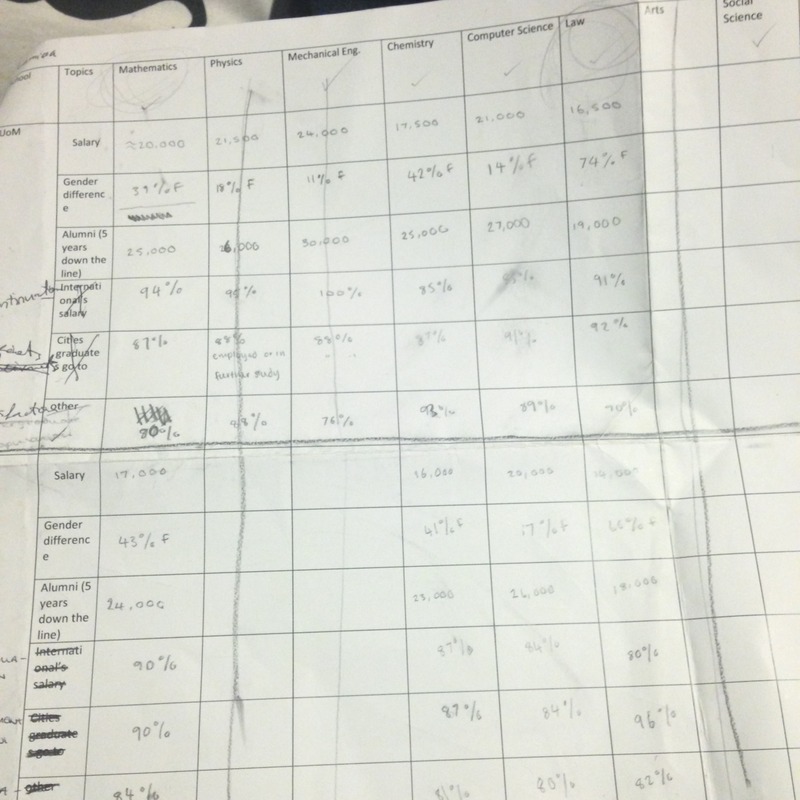
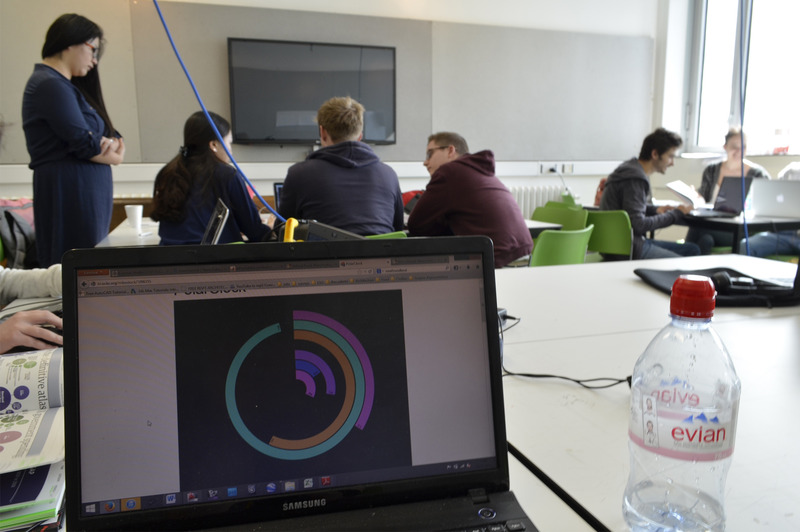
3// Visualising how we want the data to be portrayed and to which audience is important. Some examples we looked at were gender ratio (across 6 different courses), income after graduation and student course satisfaction
Posted 12 May 2014 12:22
2// Presenting data animations and interpretations.
Posted 12 May 2014 12:11
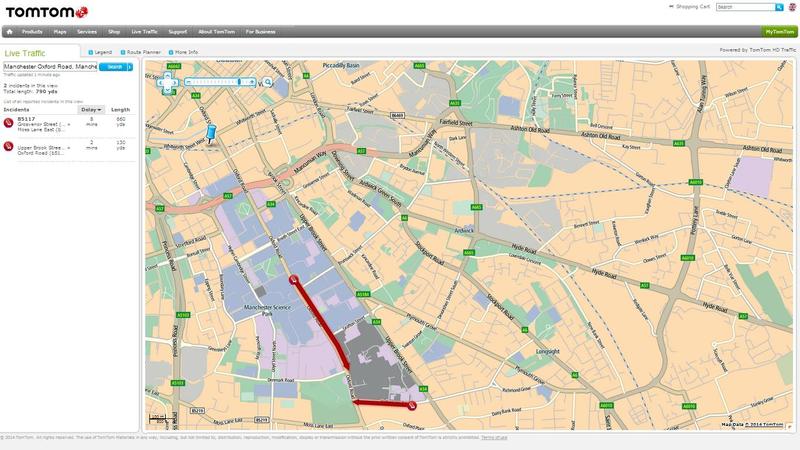
Tom Tom Traffic Congestion Survey
Posted 12 May 2014 12:01
Google Map Traffic Congestion Survey
Posted 12 May 2014 12:00
Sketch Up - Data Map - Transportation Research - Bus Route - Bus stops - Car Parks - Congestion Zone
Posted 12 May 2014 11:35
Session 3 // Mapping the Corridor
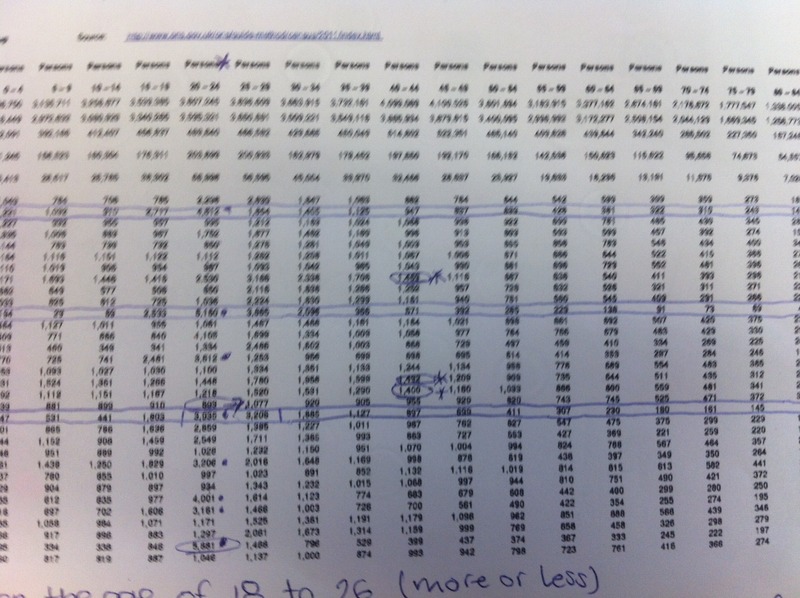
After analysing both the 1991 and 2011 Manchester Census', the group collected the required information for the ward populations and the breakdown of the age groups.
From this, we had to work out the hectare area of each individual district with a singular ward and then work out the population as a calculated estimation. Once we had the scaled population, we were able to estimate the size of each age group according to the district.
We then began to map 3 of the districts as a GOOGLE SketchUp model, resulting in each age group in a single column. They've then been extruded upwards according to their individual population and colour coded to give the resulting early visualisation of the age distribution along the corridor.
Posted 12 May 2014 11:17
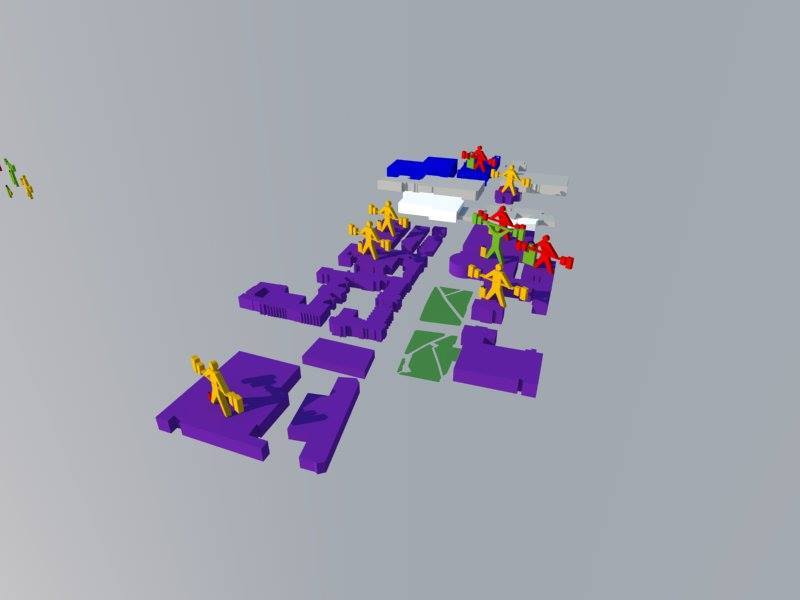
first attempt on creating a 3d visual mapping diagram for part of our data collection. The green person symbolized a percentage of over 95% of students who continue studies in every department of the university of mancehster. The red is a percentage below 90%. The bags aside these icons symbolize their employment rate after graduating.
Posted 12 May 2014 11:04
creating personalized icons inspired from the 'Noun Project' to create a map to symbolize the continuation of course within universities along oxford road.
Posted 12 May 2014 11:00
Session 2 // Collecting Methodically
The event split into smaller groups with the intention to focus their 'Big Data' research on a specific area of interest. Our smaller group therefore decided to focus on the 'distribution of age' along the corridor and so to see the density of each age group.
After receiving a CAD drawing of the areas to investigate, we began by investigating 2011 census information and divided the 'corridor boundary' into electoral wards used in the census. From this, we were able to calculate the ward population and the amount of people in each age group for the ward.
Posted 12 May 2014 10:43
Sketch Up - Mapping - Transportation Research - Buses - Routes - Oxford Road
Posted 12 May 2014 10:41
Group Discussion - Group 14
Posted 12 May 2014 10:27
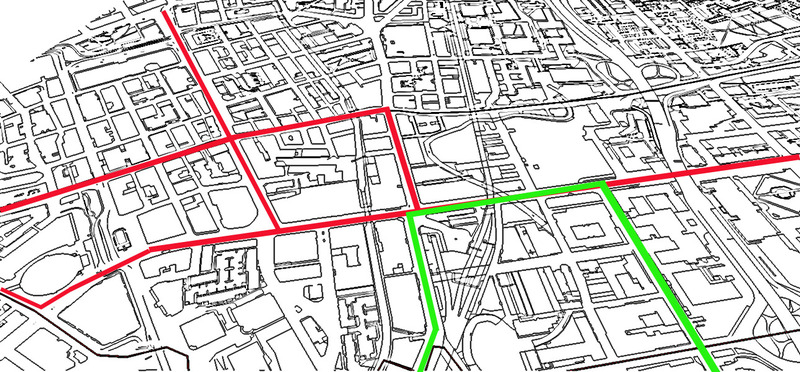
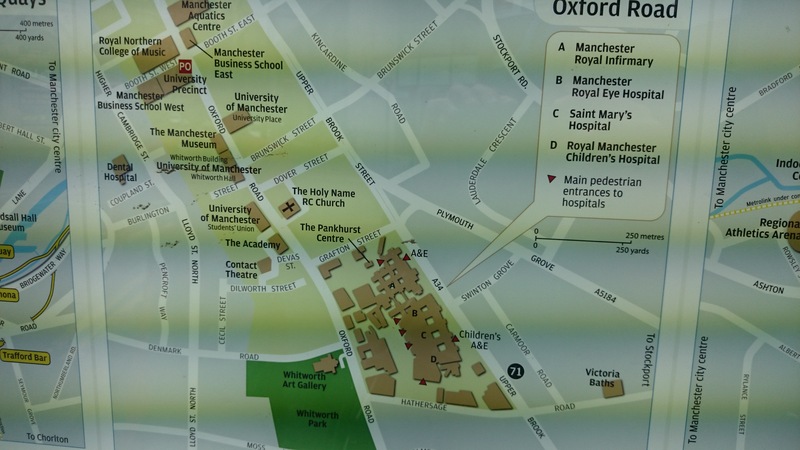
Oxford Road Mapping
Posted 12 May 2014 10:26
Session 1 // Big Data
Beginning with a talk from Ulysses Sengupta, the group were introduced to 'Big Data', methodologies of collection and the application it can have for the future of architecture. The main idea was that a piece of architecture can only affect a change within a community, so long as the community's 'Big Data' is taken into consideration prior to design.
Posted 12 May 2014 10:18
Lecture One - Group 14 - Mapping and Big Data
Posted 12 May 2014 10:09
Day 1 - As a group we chose to look at the age population down the Oxford Corridor. Through this research we wanted to find out the percentage of students living in each district in comparison to other ages. We could then compare this data to the locations of the universities.
Posted 12 May 2014 09:31
Day 1 - Presentation given introducing group to big data. The presentation showed the group how to collect such data, how to record it and then how to represent it in a way where it can be read visually.
Posted 12 May 2014 09:22
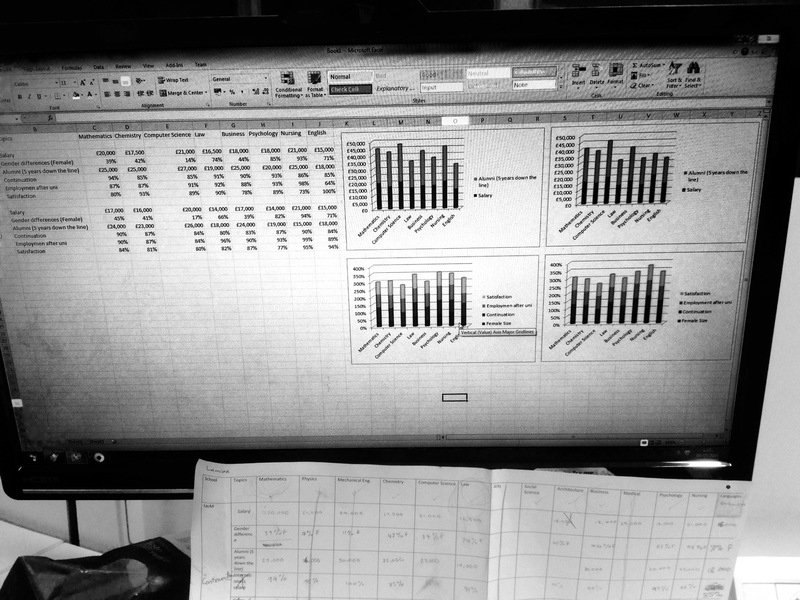
1// Collecting the data comparing the two universities was taken from various websites and spreadsheets from departments from around the University of Manchester and Manchester Metropolitan. We narrowed the comparisons down to 6 courses and chose which data we wanted to show and if it would be beneficial for the app/ students.
Posted 11 May 2014 22:07
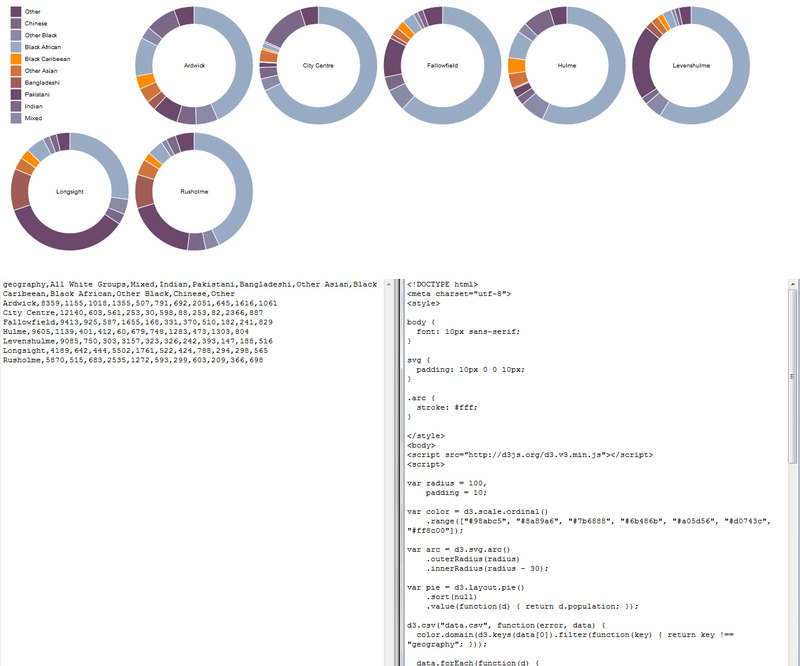
Session 1 introduced us to the idea of 'Big Data' and the use of such data in the development of design. We were given some time to choose a topic to gather data on within Oxford Road, and my group collectively decided to investigate nationality and languages spoken by people on Oxford Road.
After the session I gathered relevant data from the 2011 Census on 'Main Language Spoken' and 'Ethinicity' (as there was no data on Nationality available) in the wards within Oxford Road.
With this data I experimented with D3 (Data Driven Documents) - a javascript library that turns data into visualization. The above image shows the data, code and outcome.
Posted 11 May 2014 12:34
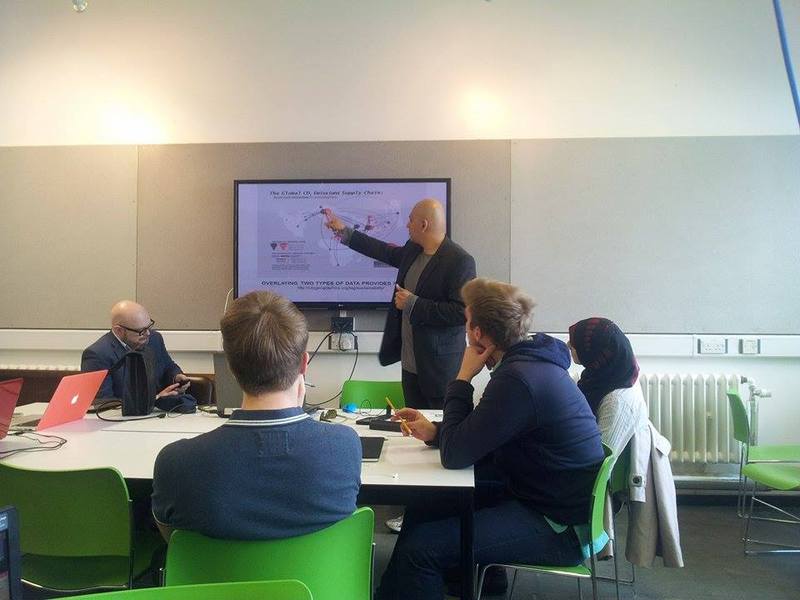
Discussions based on the geo-located 3D data map. Possibilities were found via exchanging experience s.
Posted 10 May 2014 18:16
Mapping practice after data collection.
Posted 9 May 2014 20:53
04 - Information and data collected are transformed into 3d; the image shows the average number of people getting on and off the bus at Aquactic Centre's bus stop on Oxford Road) . For the following week, we have to produce 3D visualisations of traffic flow (direction+speed), congestion (measure number), bus/car (colour-coded), buildings, bus stops, regions, etc.
Posted 9 May 2014 16:24
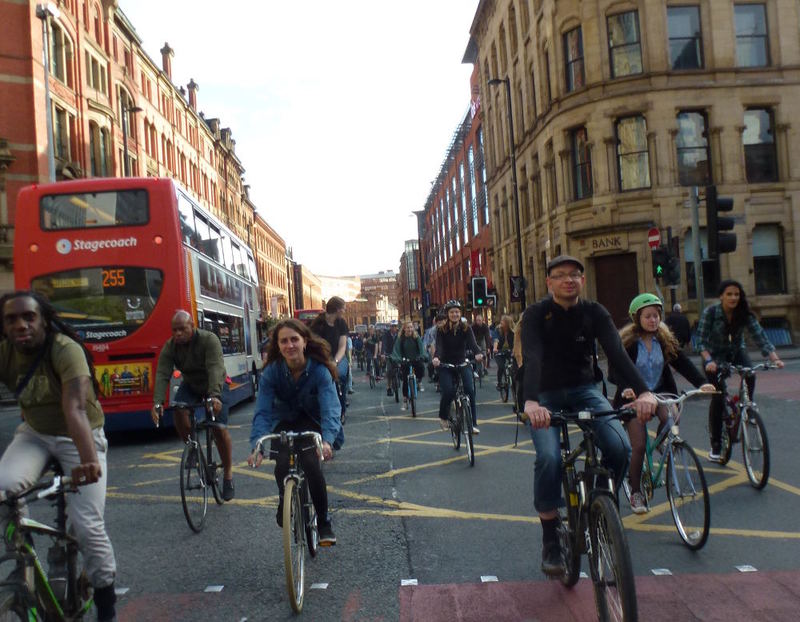
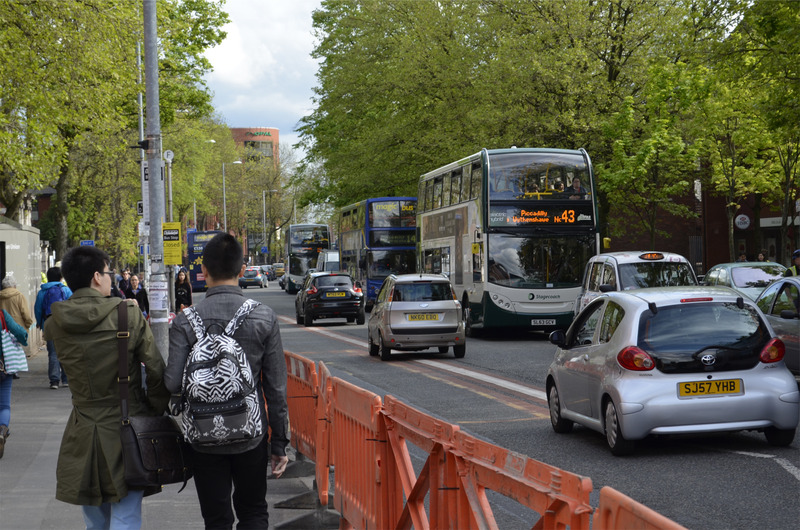
After feedback from the fifth year students, we went back onto oxford road to gather more data regarding transport, looking at areas such as traffic flow and congestion. This photograph was taken outside the Manchester Royal Infirmary building.
Posted 9 May 2014 15:13
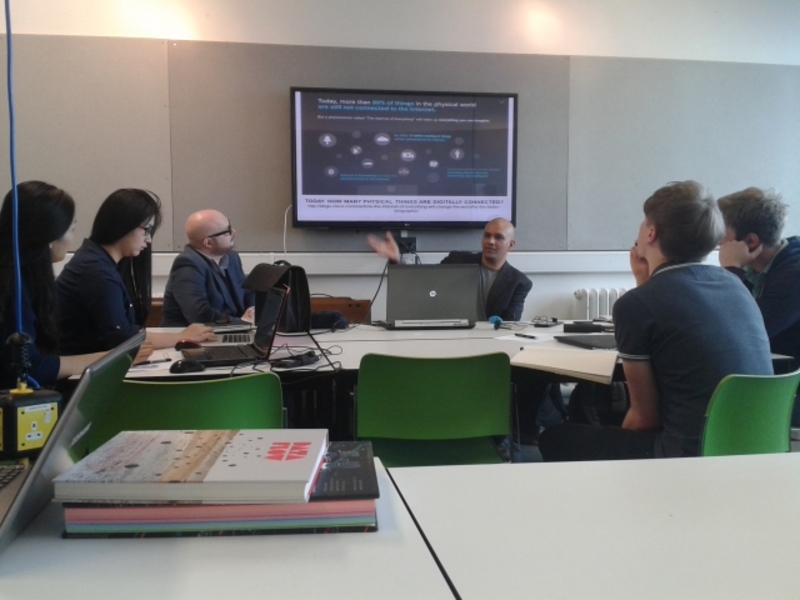
After a lecture from Ulysses Sengupta regarding ways in which we can map and visualise data, we spent the day discussing out findings with the fifth year students, and proposing how we would develop our process. We also looked at precedents regarding types of graphic representation.
Posted 9 May 2014 15:11
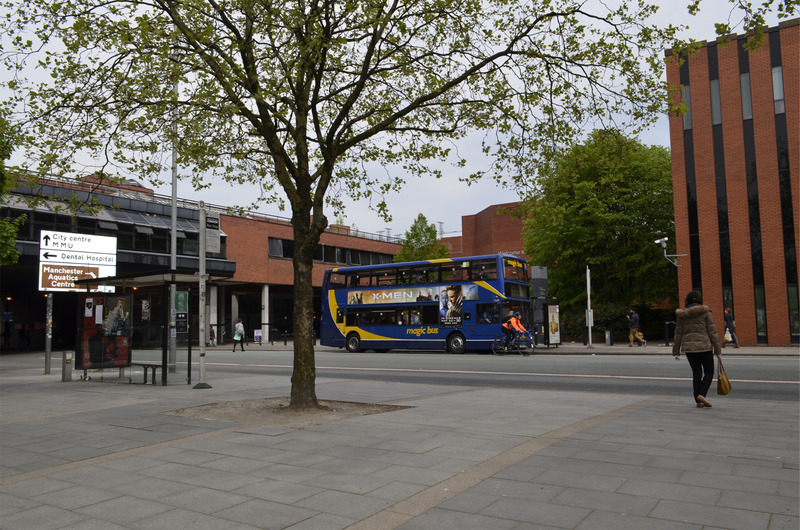
On the first day, we were split into smaller groups that would focus on different areas of information to map along Oxford Road. Our team was focusing on transport, I chose to map data and statistics regarding bus stops, the one pictured is opposite University Place.
Posted 9 May 2014 15:09
How do you translate data numbers into spatial maps? Discussing mapping and visualisation with the data city groups.
Posted 9 May 2014 12:03
03: Data collection and diagramming of teams venture (Career differences between UoM and MMU students)
Posted 8 May 2014 23:51
03 - Collecting data on site.
Posted 8 May 2014 22:00
02 - A lecture on mapping and big data is given by Ulysses Sengupta, followed by group presentation on the data collected. Our group focuses on transportation.
Posted 8 May 2014 21:54
01 - Introduction to the event (Data City), conducted by our seniors. We are divided into 5 teams to do research and collect data on different topics from Oxford Road.
Posted 8 May 2014 21:47
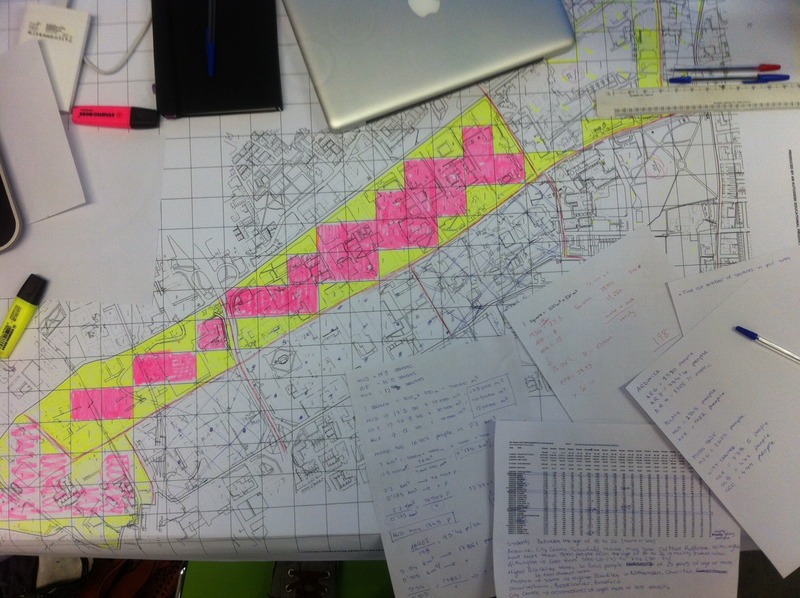
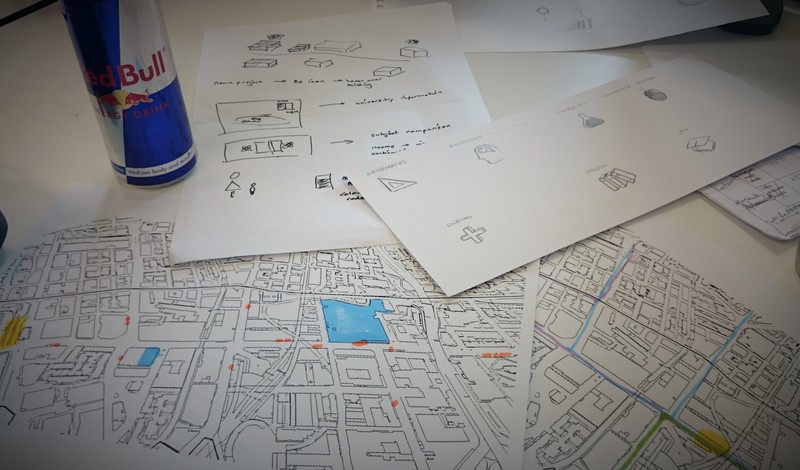
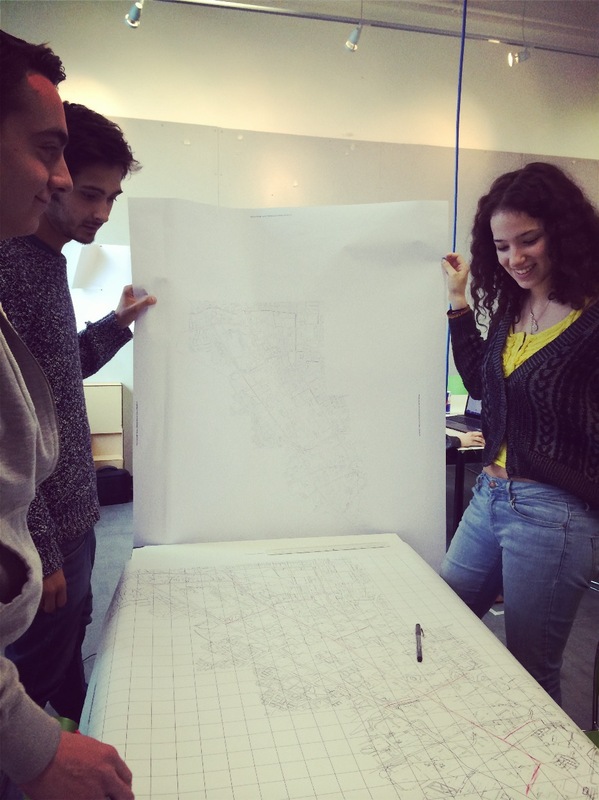
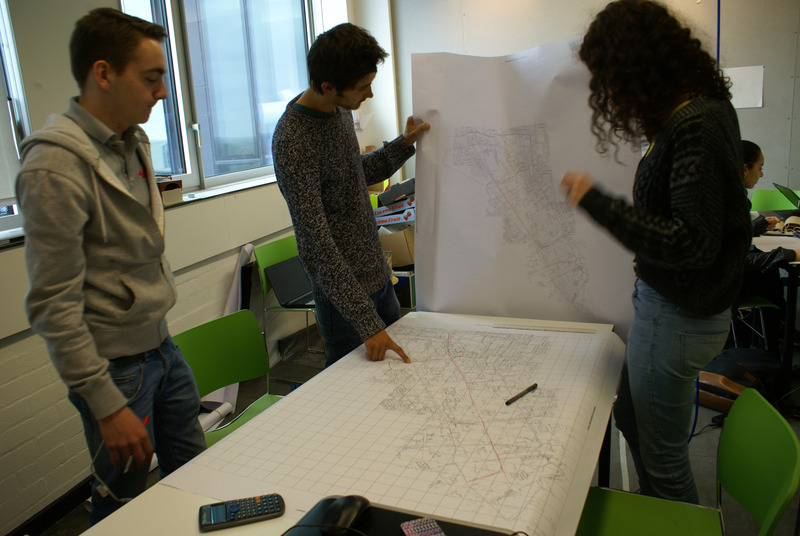
For our mapping research we wanted to get as much detailed information as we could. We found information about all the districts needed but we wanted to know the distribution in the sub districts of the area. To do so, we created a grid and investigated the number of people that lived in a hectare of each district to finally obtain all the data we wanted. Next step: Mapping the data.
Posted 8 May 2014 16:30
Ulysses Segupta showed us and explained us examples of what we were about to do. He also advised us on our research and decided to observe the concentration of students living by Oxford Road. We finally analysed a census from 2011 to understand how the different groups of ages gather in different areas and why.
Posted 8 May 2014 16:25
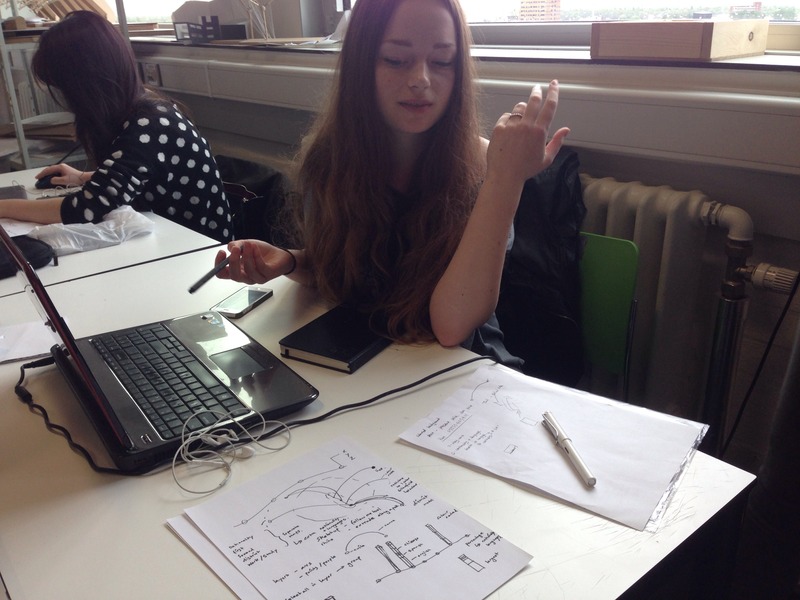
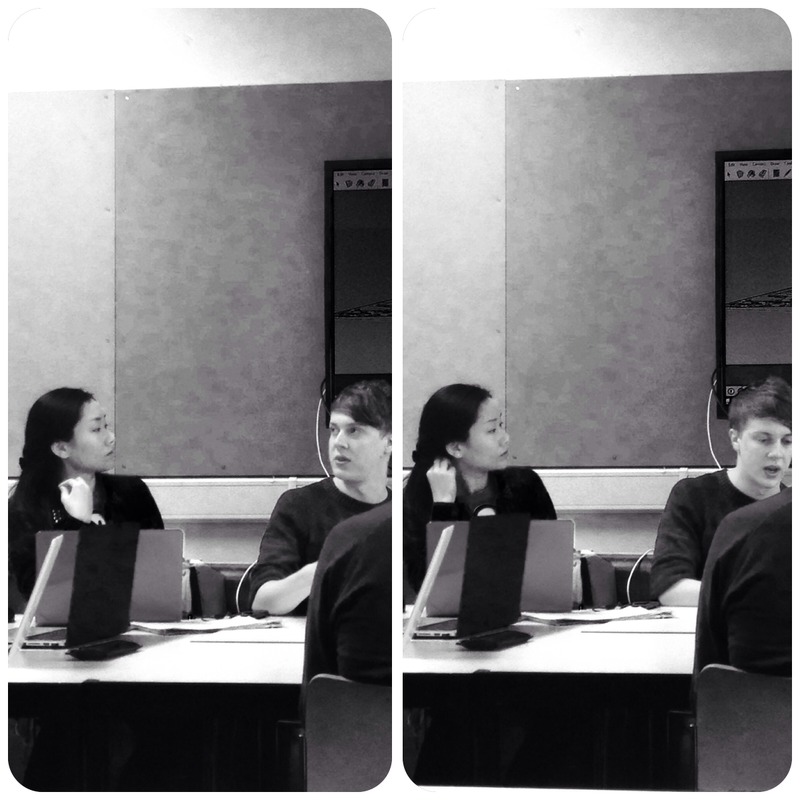
James, Karissa and Sam working on an age distribution map.
Posted 8 May 2014 11:07
Ulysses Sengupta talks to the group about mapping and big data.
Posted 8 May 2014 11:05
//2
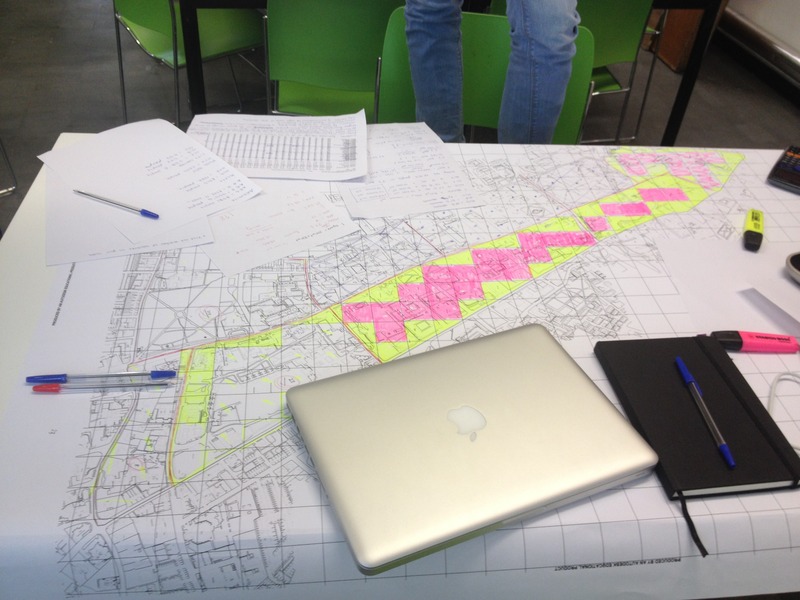
Research U-Turn as new boundaries for oxford corridor are decreased to Whitworth Gallery area. Fallowfield no longer an option rendering these data points useless.
Data collection for new boundary underway with data map being designed for Friday.
Posted 7 May 2014 18:00
//1
Introduction to the team along with an imposed appreciation of big data and the future possibilities a city along with it's respective society will be projected in. Our scope of research - Oxford corridor.
Output: Educational App with layers of 'information' - Age, Language, Job, Property Price, Income etc.
Our group's contribution: Property price changes (1995-2014) with the idea to offer future price estimations using unity software.
Posted 7 May 2014 17:46
Ulysses Sengupta's lecture was very interesting. Learnt about the differant types of mapping and how that can affect the way you end up designing.The invisible factors in within a map are very important aswel and could always be usefull when understanding how the city works0
Posted 7 May 2014 14:43
02:Ulysses Sengupta data lecture - 'Be critical of all research data because it is out of date as soon as it is produced'
Posted 6 May 2014 20:59
01: Introduction - Exploration of simulation where multiple solutions and their outcomes are tested before the construction process even begins.
Posted 6 May 2014 20:44
Mapping and Big Data
Posted 6 May 2014 15:58